RSI Overbought, DBS Stock Gains 2.24% Today
Technical analysis of DBS stock on Juli 15, 2026: price 72.03 SGD, trend uptrend, RSI 80.8, support 63.73, resistance 70.79. Key angle: RSI Overbought.

DBS Group (DBS) shares surged to 72.03 SGD on July 13, 2026, marking a robust 2.24% single-day gain and extending a staggering 13.45% rally over the past month. This price action signals a dominant bullish sentiment, placing the bank’s equity well above its moving averages and pushing it into uncharted territory above recent resistance levels. The move reflects significant market conviction, even as the stock tests the boundaries of historical volatility.
Trend and Price Action
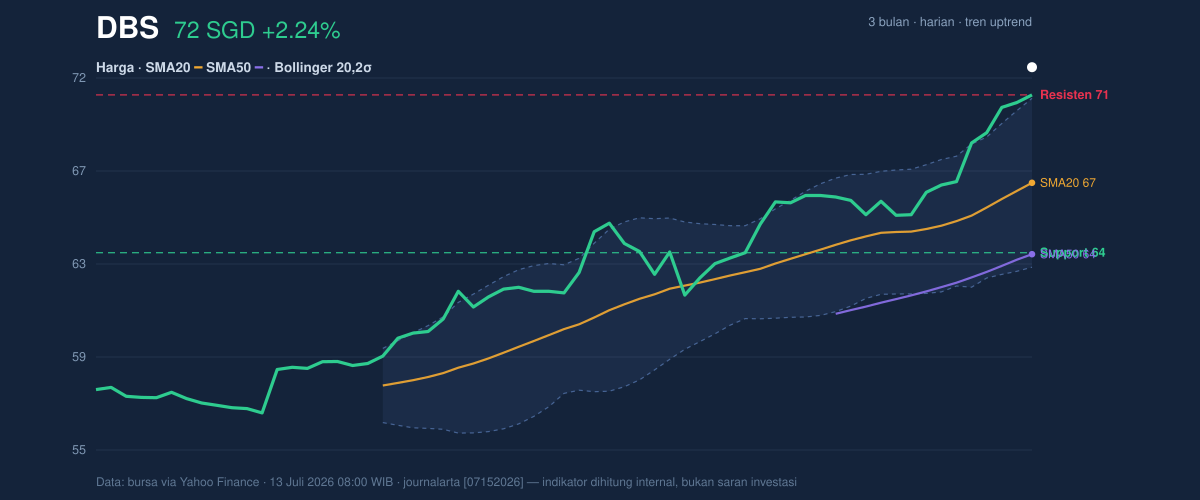
The bank’s stock is currently in a confirmed uptrend, characterized by the consistent upward slope of the SMA20, which is rising at a rate of 2.63% every five days. With the price at 72.03 SGD, it sits comfortably above both the SMA20 at 66.86 SGD and the SMA50 at 63.66 SGD. The lack of a new moving average cross suggests that the current momentum is a continuation of an established trend rather than a reflexive bounce.
However, the price has breached the upper Bollinger Band of 70.64 SGD, resulting in a %B indicator of 118%. In technical terms, a %B reading above 100% indicates that the price is trading outside the statistically expected range, often acting as a signal that the asset is becoming extended relative to its recent volatility.
Oscillators and Momentum
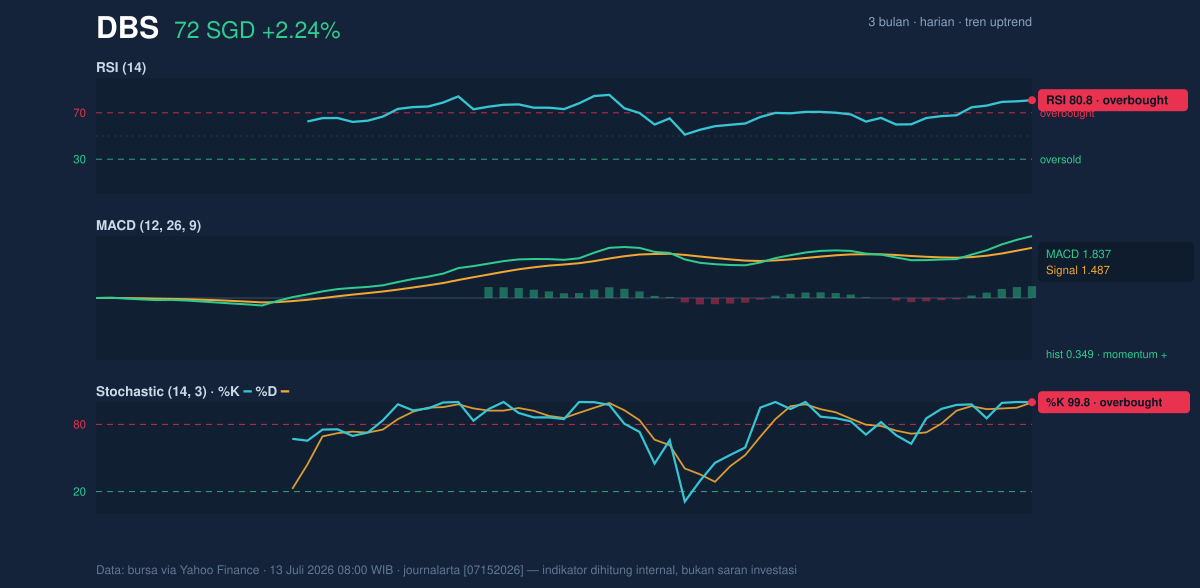
The aggressive nature of this climb is underscored by the current state of momentum indicators. The RSI is at 80.8, placing the stock deep into overbought territory, a zone where market participants typically look for signs of exhaustion. Similarly, the Stochastic oscillator, with %K at 99.8 and %D at 99.7, is pinned to the ceiling.
While these levels suggest that the pace of the rally may be unsustainable in the immediate term, the MACD remains firmly in positive territory at 1.837, with a positive histogram of 0.349. This confirms that the underlying trend strength is still driving the move, even if the oscillators are screaming for a consolidation phase.
Volatility and Volume
Interestingly, the rally is occurring amidst relatively muted participation. The latest volume of 3,601,800 is only 0.8x the 20-day average, suggesting that the current move is driven more by a lack of selling pressure than an massive influx of new buyers. The ATR of 0.89 confirms that volatility remains low, representing just 1.2% of the share price.
The OBV (On-Balance Volume) is trending upward, which acts as a vital counterpoint to the low daily volume; it suggests that the cumulative buying interest remains intact, confirming that institutional investors are likely holding their positions rather than taking profits into this strength.
Key Levels and Scenarios
With the stock having shattered the 20-day resistance of 70.79 SGD, the market has entered a price discovery phase. Should the price fail to hold above this former ceiling, we would look for a retest of the SMA20 at 66.86 SGD as the first major support level. Conversely, if the momentum continues without a pullback, the lack of immediate overhead resistance could see the stock test new psychological thresholds, provided that the RSI can digest these overbought levels through sideways movement rather than a sharp correction.
Technical Verdict: HOLD (wait & see)
The HOLD verdict is driven by the following factors:
* Extreme Overbought Conditions: Both the RSI (80.8) and Stochastic (99.8) suggest the stock is significantly extended, raising the probability of a near-term cooling-off period.
* Bollinger Band Extension: The %B of 118% indicates the price is stretched far beyond the mean, which historically precedes a consolidation phase.
* Low Relative Volume: The rally is occurring on sub-average volume, suggesting a lack of aggressive new buying at these elevated levels.
This verdict is invalidated if the price breaks decisively below 66.86 SGD, which would signal a shift in the current bullish trend.
In plain English, the stock has moved too far, too fast, and is now waiting for the rest of the market to catch up or for the price to settle before the next move can be safely identified.
*Disclaimer: This analysis is for educational purposes only and does not constitute financial advice. Investors should consult with a qualified advisor before making any investment decisions.*
Summary Data DBS
| Last price | 72.03 SGD |
| Change 1 day / 5 days / 1 month | 2.24% / 7.65% / 13.45% |
| Trend / MA-cross | uptrend / none |
| SMA20 / SMA50 | 66.86 / 63.66 |
| RSI (14) / Stochastic %K | 80.8 / 99.8 |
| Bollinger %B / ATR | 118% / 0.89 |
| Support / Resistance 20 days | 63.73 / 70.79 |
| Data as of | 13 Juli 2026 08:00 WIB |



