RSI Overbought, OCBC Stock Gains 1.64% Today
Technical analysis of OCBC stock on Juli 15, 2026: price 27.88 SGD, trend uptrend, RSI 81.3, support 24.26, resistance 27.48. Key angle: RSI Overbought.

OCBC Bank (O39.SI) shares surged to 27.88 SGD in the latest trading session, reflecting a sharp 1.64% daily gain and an impressive 9.38% advance over the past five trading days. According to Singapore Exchange data, this rapid ascent has pushed the stock well beyond its recent three-month high of 27.56 SGD, signaling a robust expansion in investor appetite. As the broader financial sector navigates shifting interest rate expectations, the bank’s momentum has effectively decoupled from the mean, trading significantly above its key moving averages.
Trend and Structural Dynamics
The current price structure is defined by an aggressive uptrend, with the SMA20 at 25.45 SGD and the SMA50 at 24.06 SGD confirming a healthy stack, where short-term sentiment remains firmly supported by mid-term accumulation. The slope of the SMA20, rising at a rate of 3.62% over five days, illustrates that this move is not merely a flicker but a sustained acceleration in demand. Currently positioned at 112% of its 20-day range, the stock has effectively broken through its established resistance levels, entering a phase of price discovery.
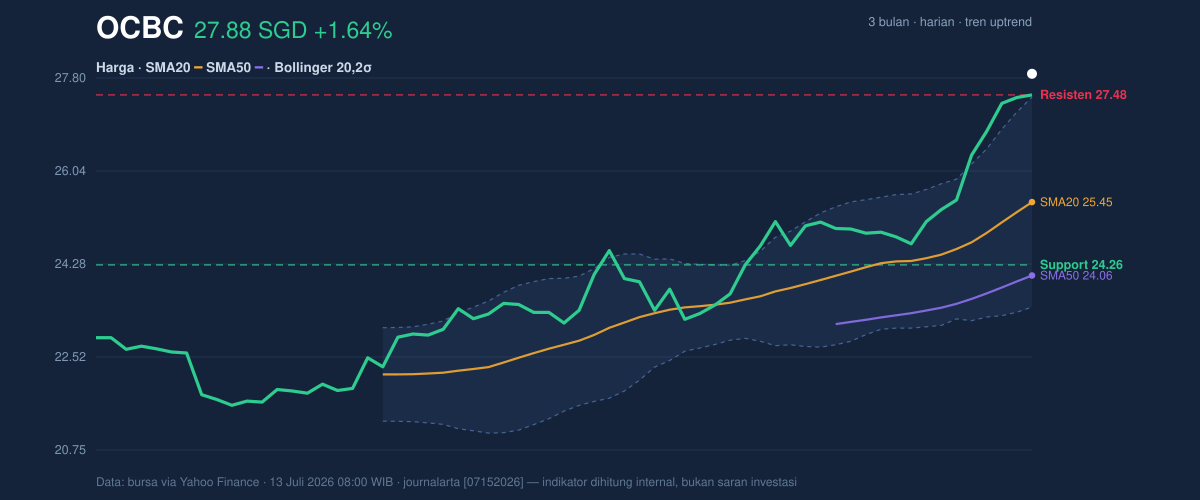
The breach of the Bollinger Band upper threshold of 27.44 SGD is a critical observation. With a %B of 111%, the price is currently trading outside the statistically expected range, which often acts as a precursor to either an extended parabolic run or a temporary mean-reversion pull. Despite this, the ATR(14) of 0.41 indicates that the stock’s volatility remains relatively subdued at 1.5% of its price, suggesting that this move is driven by steady institutional conviction rather than speculative frenzy.
Momentum and Divergence Risks
While the price action is undeniably strong, the momentum indicators offer a cautionary narrative. The RSI(14) at 81.3 firmly places the stock in overbought territory, a zone where buying exhaustion historically begins to materialize. Similarly, the Stochastic oscillator (97.3 %K / 95.3 %D) confirms this extreme positioning, signaling that the immediate upside momentum may be reaching a saturation point.
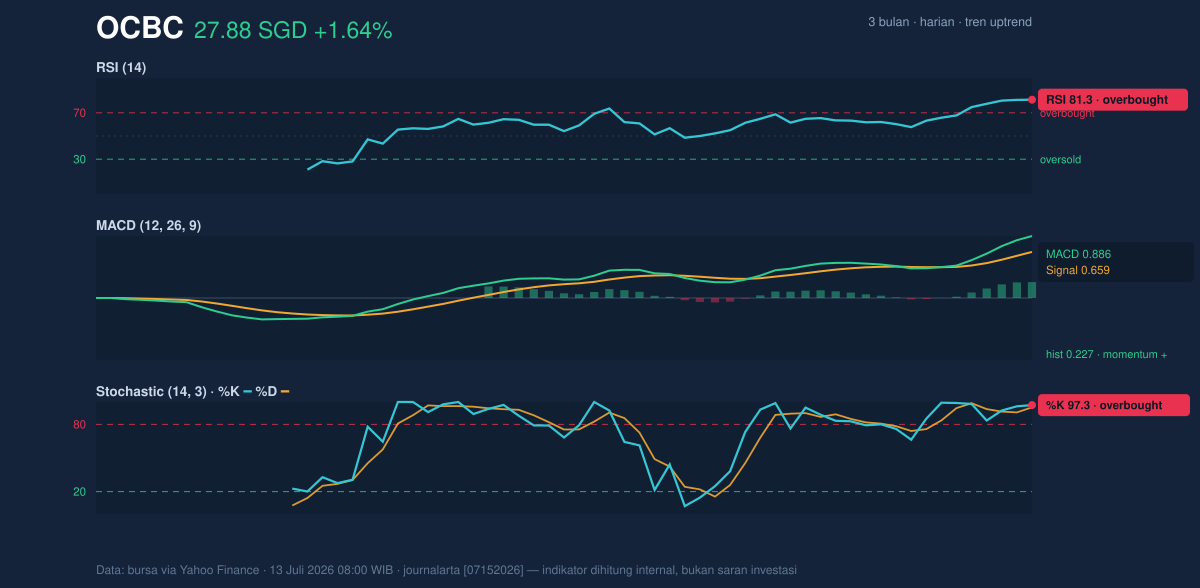
However, the MACD of 0.886 relative to its signal line of 0.659, alongside a positive histogram of 0.227, shows that the underlying trend strength is still intact. There is no bearish divergence yet between the price peaks and the MACD, suggesting that while the stock is statistically overextended, the technical machinery behind the rally has not yet signaled a breakdown.
Volume Participation
Trading volume reached 4,627,800 shares, which sits at roughly 0.8x the 20-day average of 5,885,876. This divergence—where price hits new highs on lower-than-average volume—indicates that while the bulls remain in absolute control, the urgency of new buying is slightly decelerating. Crucially, the OBV (On-Balance Volume) remains in an uptrend, suggesting that participants are largely holding their positions rather than exiting, maintaining the structural integrity of the rally.
Technical Verdict: HOLD (wait & see)
The current technical stance is a HOLD (wait & see) for the following reasons:
* The RSI and Stochastic are in deep overbought territory, suggesting the stock is prone to a brief corrective pull-back to realign with its moving averages.
* The stock is trading outside the Bollinger Band upper limit, increasing the probability of a cooling-off period rather than a clean breakout above the 27.48 SGD resistance.
* The verdict is invalidated if the price decisively breaks and sustains above 27.56 SGD, which would nullify the overbought signal and initiate a new phase of momentum.
For the non-technical observer, the bank is currently trading at a "hot" level where a small step back to catch breath would be considered a normal part of a healthy long-term trend rather than a sign of a structural collapse.
The next critical update for the bank is the upcoming dividend declaration, which historically serves as a catalyst for institutional re-weighting.
Summary Data OCBC
| Last price | 27.88 SGD |
| Change 1 day / 5 days / 1 month | 1.64% / 9.38% / 17.59% |
| Trend / MA-cross | uptrend / none |
| SMA20 / SMA50 | 25.45 / 24.06 |
| RSI (14) / Stochastic %K | 81.3 / 97.3 |
| Bollinger %B / ATR | 111% / 0.41 |
| Support / Resistance 20 days | 24.26 / 27.48 |
| Data as of | 13 Juli 2026 08:00 WIB |



