GOOGL Stock Gains 11.94% Today, Testing Key Resistance
On Agustus 4, 2026: price 373.51 USD, trend sideways, RSI 54.1, support 317.69, resistance 370.92. technical analysis of googl stock. GOOGL Stock Gains — full…

Alphabet’s latest move puts it back near the top of its recent trading band, but the signal is more about momentum than a clean breakout. On Nasdaq, GOOGL last changed hands at 373.51 dollars, up 11.94% on the day, after a week that added 16.82% — a sharp rebound that has pushed the stock above its short-term average and close to the upper edge of its volatility envelope.
Trend & Price Action
The stock is still described as sideways, and that matters: a sideways trend means the market has not yet committed to a sustained directional move, even after a strong rally. The key detail is that price now sits above the SMA20 at 348.05 and also above the SMA50 at 358.74, which tells traders the rebound has regained short-term and medium-term footing. But the absence of a fresh MA-cross means this is not yet a classic trend-change signal; the averages are aligned in a way that supports the bounce, not one that confirms a new uptrend.
The chart also shows price trading at 105% of the 20-hour range, with resistance at 370.92 already being tested. That positioning is important: when a stock sits near the top of its recent range, the market is saying buyers have control for now, but there is little room for complacency. The 3-month range reinforces that tension, with the stock still below the 3-month high of 408.61 and well above the 3-month low of 314.90.
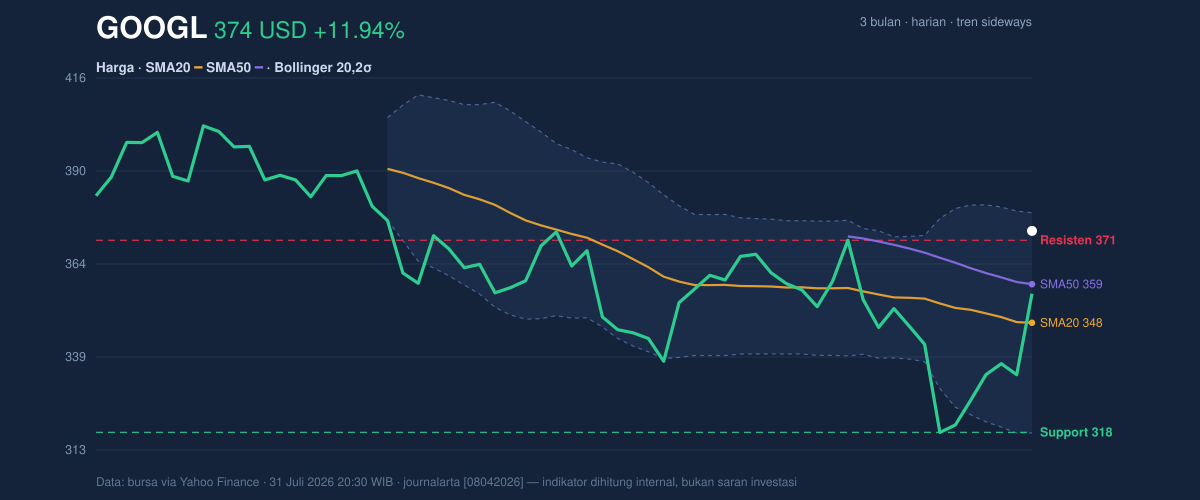
The message from price action is simple. The rebound is real, but it still needs acceptance above resistance to prove it is more than a fast squeeze higher.
Oscillators & Momentum
The momentum tools are mixed, and that mix is what makes this setup interesting. The RSI at 54.1 is neutral, which usually means the stock is neither overbought nor oversold. In plain language, the market is not stretched enough to warn immediately of exhaustion, but it is also not weak enough to suggest a bargain-hunting phase. The Stochastic %K at 68.3 and %D at 45.2 are also neutral, though the spread between the two lines suggests momentum is still improving rather than fading.
The most constructive signal comes from MACD at -6.547, with the signal line at -7.217 and a positive histogram of 0.670. For readers less familiar with the term, MACD is a trend-following indicator that looks at whether shorter-term price action is gaining on longer-term price action. Even though the MACD line remains below zero, the positive histogram means the gap is narrowing in a bullish direction — a sign that downside pressure has eased and the rebound has some internal support.
That is the key nuance: momentum is positive, but not yet fully resolved into a stronger trend.
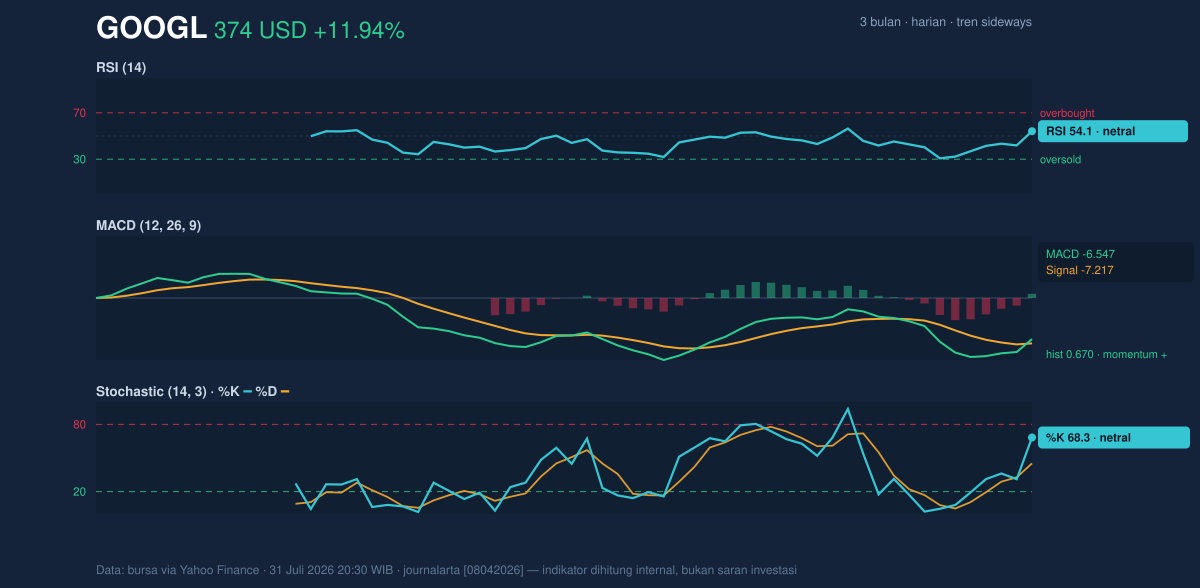
This is the kind of chart that can keep climbing — or stall quickly if buyers fail to extend the move.
Volatility & Volume
Volatility is elevated. The ATR at 13.25, or 3.5% of price, signals that daily moves remain large enough to matter. ATR, or average true range, is a measure of how much the stock typically swings; a higher reading means traders should expect wider intraday movement and less precision around entry or exit levels. That matters here because the stock is already pressing into resistance, where volatility can either fuel a breakout or trigger a sharp rejection.
Bollinger Bands add another layer. Price is near the upper band at 378.56, with %B at 92% and a normal band width of 17.5%. A %B reading that high means the stock is trading very close to the top of its recent statistical range. That is not automatically bearish, but it does mean the move is extended relative to the last 20 sessions. If the stock can hold near the upper band without snapping back, that usually implies stronger demand. If it cannot, mean reversion — a drift back toward the middle band — becomes more likely.
Volume confirms that the move has participation behind it. Last volume was 46,498,000, about 1.5× the 20-hour average of 30,015,640, and OBV is rising. OBV, or on-balance volume, tracks whether volume is supporting price gains. Rising OBV alongside a price rebound is one of the cleaner signs that the move is being bought rather than simply short-covered.
The tape is not quiet. It is being traded.
Key Levels & Scenarios
The most important nearby levels are clear from the chart and the data. Resistance at 370.92 is the immediate hurdle, while the Bollinger upper band at 378.56 marks the next technical ceiling. On the downside, support at 317.69 is the main line of defense, with the Bollinger middle band at 348.05 now acting as a pivot area because it overlaps the SMA20.
If price can hold above 370.92 and keep volume elevated, the chart would suggest continued pressure toward 378.56 and then the upper part of the 3-month range. If it fails to hold 348.05, the rebound loses some of its credibility and the stock could rotate back toward 317.69. A break below that support would put the recent recovery in doubt.
Technical Verdict: HOLD (wait & see)
HOLD (wait & see)
- RSI at 54.1 and Stochastic at 68.3 / 45.2 are neutral, so momentum is supportive but not decisive.
- MACD histogram at 0.670 is positive, which confirms improving momentum, but MACD remains below zero, so the trend is not fully reset.
- Price is above the SMA20 at 348.05 and SMA50 at 358.74, yet resistance at 370.92 and the upper Bollinger band at 378.56 are still in the way.
- Invalidation: this verdict is invalidated if price falls below 348.05, with deeper concern if 317.69 gives way.
- Ideal Entry Range: 348.05 to 358.74
- Exit Target: 370.92 to 378.56
- Stop Loss protection: 317.69
For non-traders, this means the stock has improved, but it still needs proof that the rebound can hold.
“It’s a recovery with conviction, but not yet with final confirmation.”
Summary Data GOOGL
| Last price | 373.51 USD |
| Change 1 day / 5 days / 1 month | 11.94% / 16.82% / 3.78% |
| Trend / MA-cross | sideways / none |
| SMA20 / SMA50 | 348.05 / 358.74 |
| RSI (14) / Stochastic %K | 54.1 / 68.3 |
| Bollinger %B / ATR | 92% / 13.25 |
| Support / Resistance 20 days | 317.69 / 370.92 |
| Data as of | 31 Juli 2026 20:30 WIB |
Track GOOGL stock price daily: live levels, support/resistance and our full GOOGL analysis history.


