Testing Key Resistance, ORCL Stock Gains 2.74% Today
On Agustus 11, 2026: price 151.05 USD, trend sideways, RSI 59.3, support 114.99, resistance 151.05. technical analysis of orcl stock. Testing Key Resistance —…

Oracle is pressing against the top of its recent trading range, and that matters because the stock is now priced for momentum rather than hesitation. At 151.05 USD, Oracle (NYSE: ORCL) is up 2.74% on the day, 6.49% over 5 days and 14.83% over 1 month, according to Yahoo Finance data as of 10 August 2026 20:30 WIB. The move has taken the shares to the upper edge of the Bollinger band and the 20-hour resistance, but the technical picture is not a simple breakout story: trend, momentum and volume are sending mixed messages.
Trend & Price Action
The first signal is location. Oracle is trading above the SMA20 at 130.45, which shows the short-term trend has improved sharply, but it remains below the SMA50 at 159.24. That gap matters: it suggests the latest rally has recovered ground quickly, yet the broader intermediate trend has not fully turned in favor of buyers. With no fresh moving-average cross, the chart is still in a transitional phase rather than a confirmed trend reversal.
The slope of the SMA20 rising 1.29% over 5 days reinforces that short-term price pressure is upward. But the stock is also sitting at the extreme of its recent range, with 20-hour support at 114.99 and 20-hour resistance at 151.05. In other words, the price is at the ceiling of the measured range, not in the middle where there is room to breathe.
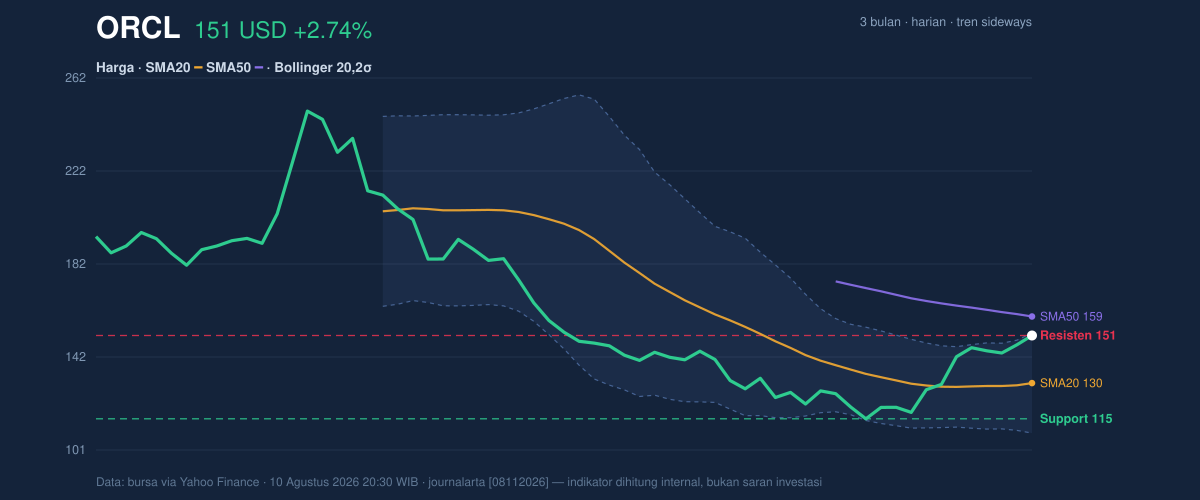
As shown in the chart, Oracle has already tested the top of the band structure. That is a sign of strength, but also a sign that the market is asking whether the move has gone too far, too fast.
Oscillators & Momentum
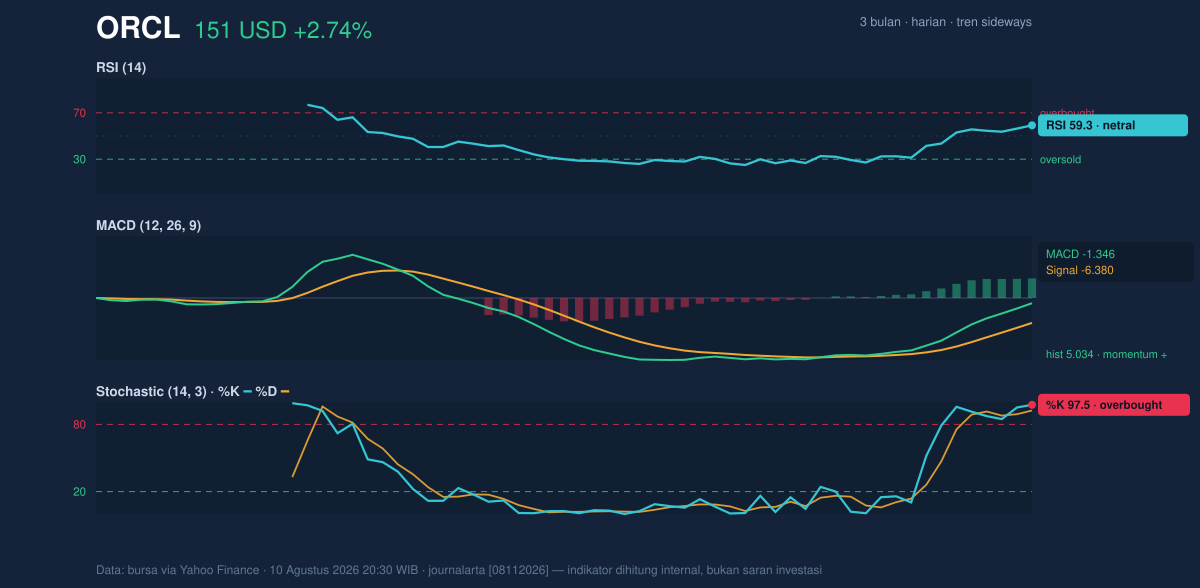
Momentum indicators are split, and that split is the most important clue in the chart. The RSI at 59.3 is neutral, which means the stock is not yet in a classic overbought reading on that measure. RSI is useful because it gauges the speed of recent gains: at this level, it says the rally is healthy, but not exhausted.
The Stochastic at 97.5 / 92.4 is overbought, however, and that is a sharper warning. Stochastic compares the current price with its recent range, so a reading near 100 usually means the stock is trading near the top of that range. In plain English: buyers have pushed Oracle to the upper limit of recent enthusiasm, and that often leaves less room for immediate upside without a pause.
The MACD at -1.346 versus signal -6.380, with a 5.034 histogram, is still positive in structure. MACD is a trend-following indicator, and the positive histogram tells us the faster line is above the slower one, which supports the idea that upward momentum is improving. That said, the fact that the MACD line remains below zero means the longer rhythm of the chart has not fully flipped into a strong bullish phase.
So the message from momentum is not “breakout confirmed.” It is “uptrend improving, but stretched.”
Volatility & Volume
Volatility is elevated. The Bollinger band width at 33.2% is expanding, which usually means the market expects larger swings rather than calm trade. The %B at 98% shows price is hugging the upper band, a classic sign of strength that can also precede consolidation if buyers pause. Meanwhile, the ATR at 7.11, or 4.7% of price, confirms that Oracle is moving with above-average daily range risk.
Volume complicates the picture. Last volume was 24,194,000, well below the 20-hour average of 35,967,990, or 0.7× normal. That matters because price gains are more convincing when they come with heavier participation. A rise on lighter volume can still work, but it suggests the move may be driven by fewer hands than a full-throttle breakout would require. The OBV is rising, though, which means cumulative volume flow still leans constructive even if the latest session was not especially crowded.
This is the tension in the chart: price is strong, but participation is not fully matching the move.
Key Levels & Scenarios
The most immediate level is simple: 151.05 is both the latest price and the current resistance line. If Oracle can hold above this area, the chart would remain pinned near its upper band, and the next test would be whether the market can sustain price discovery beyond the recent ceiling. If it fails to hold, the first place to watch is the SMA20 at 130.45, which also matches the Bollinger midline and acts as a key pivot for the short-term trend.
The broader safety net sits much lower at 114.99, with the 3-month low at 114.50. That zone matters because it separates a normal pullback from a deeper reset of the rally structure. On the upside, the 3-month high at 250.25 is the distant reference point, but it is not an immediate chart guide; the near-term story is about whether the current surge can hold its gains.
The core signal is mixed: Oracle is strong enough to stay elevated, but stretched enough to risk a pause.
Technical Verdict: HOLD (wait & see)
HOLD (wait & see)
- RSI at 59.3 is neutral, so the stock is not overextended on that measure.
- Stochastic at 97.5 / 92.4 is overbought, warning that the rally is near a short-term extreme.
- MACD histogram at 5.034 is positive, but price remains below SMA50 at 159.24, so the broader trend is not fully confirmed.
- Verdict invalidated if price falls below 130.45, because that would break the short-term trend pivot and the Bollinger midline at the same time.
- Ideal Entry Range: 130.45 to 114.99
- Exit Target (Target Price): 151.05 as the first resistance, with 159.24 as the next technical ceiling
- Stop Loss protection: 114.99, with the deeper reference at 114.50
For non-traders: Oracle’s chart looks strong, but it is already stretched near resistance, so the safest reading is to wait for proof that the move can hold.
Summary Data ORCL
| Last price | 151.05 USD |
| Change 1 day / 5 days / 1 month | 2.74% / 6.49% / 14.83% |
| Trend / MA-cross | sideways / none |
| SMA20 / SMA50 | 130.45 / 159.24 |
| RSI (14) / Stochastic %K | 59.3 / 97.5 |
| Bollinger %B / ATR | 98% / 7.11 |
| Support / Resistance 20 days | 114.99 / 151.05 |
| Data as of | 10 Agustus 2026 20:30 WIB |

