XOM Stock Gains 4.41%, Testing Key Resistance In Focus
On Agustus 11, 2026: price 159.79 USD, trend uptrend, RSI 65.2, support 144.51, resistance 159.79. technical analysis of xom stock. XOM Stock Gains — full…

ExxonMobil climbed to 159.79 USD on the NYSE, up 4.41% from the prior close of 153.04, as the stock pushed to the top of its recent trading range and came within reach of its 3-month high. The move matters because it shows buyers are still willing to pay up after a strong month, but the chart also shows the advance is now pressing against resistance rather than building from a quiet base.
Trend & Price Action
The broader structure remains constructive. ExxonMobil is still in an uptrend, with the SMA20 at 152.83 rising at a 2.33%/5-day slope, while the SMA50 at 146.74 sits below both price and the shorter average. That alignment tells readers the stock is not just bouncing; it is trading above both short- and medium-term trend markers, which usually signals that recent demand has been strong enough to keep sellers from regaining control.
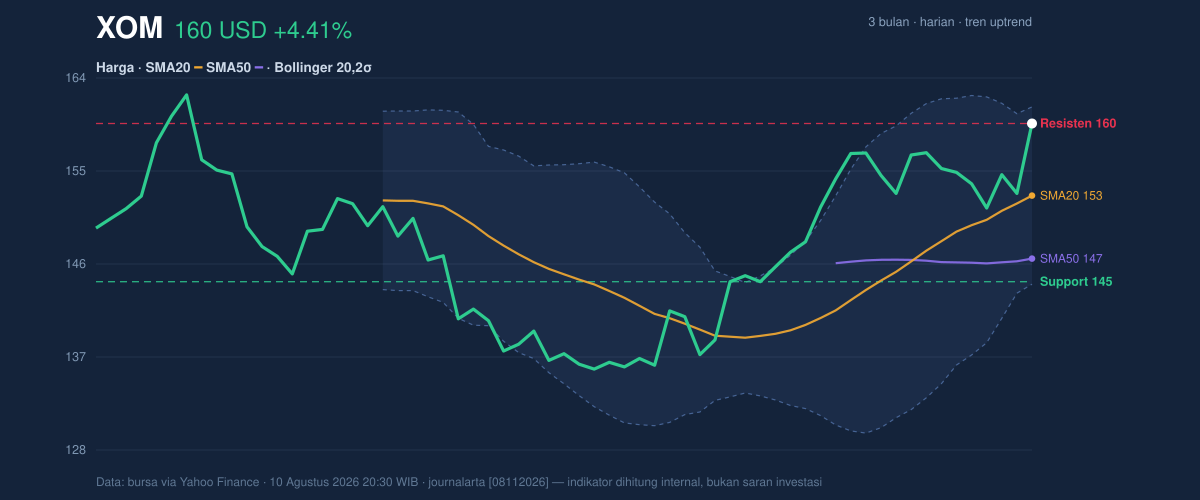
Price is also sitting at the very top of the 20-hour range, with support at 144.51 and resistance at 159.79. In plain terms, the stock has already traveled to the ceiling of the recent corridor, so any further advance needs fresh buying to avoid stalling. The 3-month high of 163.68 is close enough to matter: if the stock keeps holding above the current band, that prior peak becomes the next obvious test, while a failure here would suggest the rally is running into a familiar supply zone.
Oscillators & Momentum
Momentum is positive, but it is no longer cleanly aligned across indicators. The RSI at 65.2 is still labeled neutral, which means the stock is not yet in a classic overbought warning zone, but it is close enough to the upper end of the scale to show enthusiasm is elevated. By contrast, the Stochastic %K at 94.9 versus %D at 68.3 is overbought, a sign the latest push may have moved faster than the underlying trend can comfortably absorb. That does not automatically mean a reversal is imminent; it means short-term traders are already crowding into the move, which often makes the next few sessions more vulnerable to pauses or sharp intraday swings.
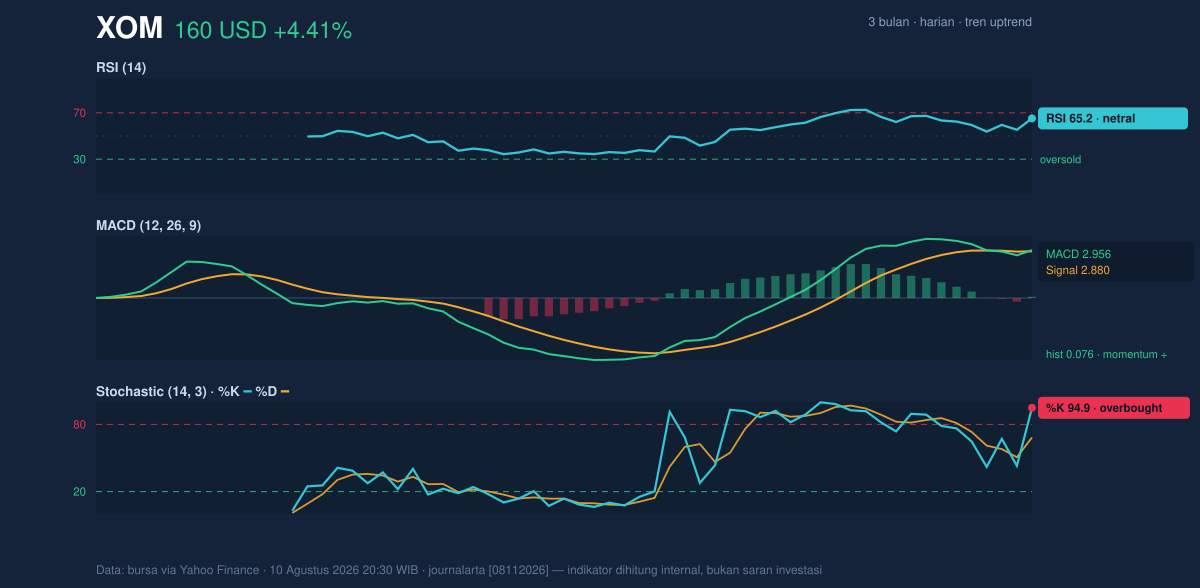
The MACD at 2.956, above its signal at 2.880 with a 0.076 histogram, still points to positive momentum. In practical terms, MACD is saying the trend remains intact even as the faster oscillator is stretched. That combination often appears late in an advance: the trend can continue, but the margin for error narrows because momentum is strong rather than fresh.
Volatility & Volume
The Bollinger setup reinforces that reading. Price is trading with %B at 91%, which places it near the upper band at 161.39, while the middle band sits at 152.83 and the lower band at 144.26. When price hugs the upper band, it usually means the stock is strong, but it can also indicate the move is extended relative to its recent average. The 11.2% band width is described as normal, so this is not a classic squeeze that would warn of a coming breakout from compressed trading; instead, the stock is already moving within an ordinary volatility envelope, and the question is whether buyers can keep the price pinned near the top without exhaustion.
The ATR at 4.29, or 2.7% of price, points to moderate day-to-day movement. That matters because it suggests the stock can still swing meaningfully without signaling stress. Volume adds a second layer: the latest session’s 19,753,900 shares were about 1.3× the 20-hour average of 14,670,180, which shows participation improved as the stock advanced. Yet OBV is down, and that divergence is important: on-balance volume falling while price rises can mean the rally is not being fully confirmed by cumulative money flow. In other words, the stock is rising, but the broader volume backdrop is not as supportive as the price action alone suggests.
Key Levels & Scenarios
The immediate map is clear. 159.79 is both the latest price and the current resistance line, so it is the first level that needs to be cleared for the chart to improve further. Above that, 161.39 is the upper Bollinger band, and 163.68 is the 3-month high that would likely attract attention if momentum extends. On the downside, 152.83 is the middle Bollinger band and the SMA20, making it the first meaningful area where a pullback would be judged. If that fails, 146.74 at the SMA50 becomes the next structural support, with 144.51 marking the lower edge of the recent range.
The signal mix is therefore straightforward: the trend is up, momentum is positive, but the stock is also stretched near resistance and the stochastic is overheated. That combination often favors consolidation more than immediate acceleration unless price can hold above the current ceiling.
Technical Verdict: HOLD (wait & see)
HOLD (wait & see)
- MACD remains positive and above the signal line, which supports the trend.
- Price is above SMA20 and SMA50, confirming the broader uptrend.
- Stochastic is overbought and OBV is down, which weakens confidence in an immediate breakout.
Verdict invalidated if price falls below 152.83, because that would mean the stock has lost its short-term trend anchor.
- Ideal Entry Range: 152.83 to 146.74
- Exit Target: 161.39 to 163.68
- Stop Loss protection: 144.51
In plain English, the chart still looks healthy, but the stock is already close to a level where it may need to pause before it can go higher.
Summary Data XOM
| Last price | 159.79 USD |
| Change 1 day / 5 days / 1 month | 4.41% / 3.05% / 10.57% |
| Trend / MA-cross | uptrend / none |
| SMA20 / SMA50 | 152.83 / 146.74 |
| RSI (14) / Stochastic %K | 65.2 / 94.9 |
| Bollinger %B / ATR | 91% / 4.29 |
| Support / Resistance 20 days | 144.51 / 159.79 |
| Data as of | 10 Agustus 2026 20:30 WIB |


