XOM Stock Analysis: Gains 2.71%, Testing Key Resistance
On October 8, 2026: price 168.50 USD, trend uptrend, RSI 64.0, support 158.30, resistance 169.32. technical analysis of xom stock. XOM Stock Analysis — full…
Trend & Price Action
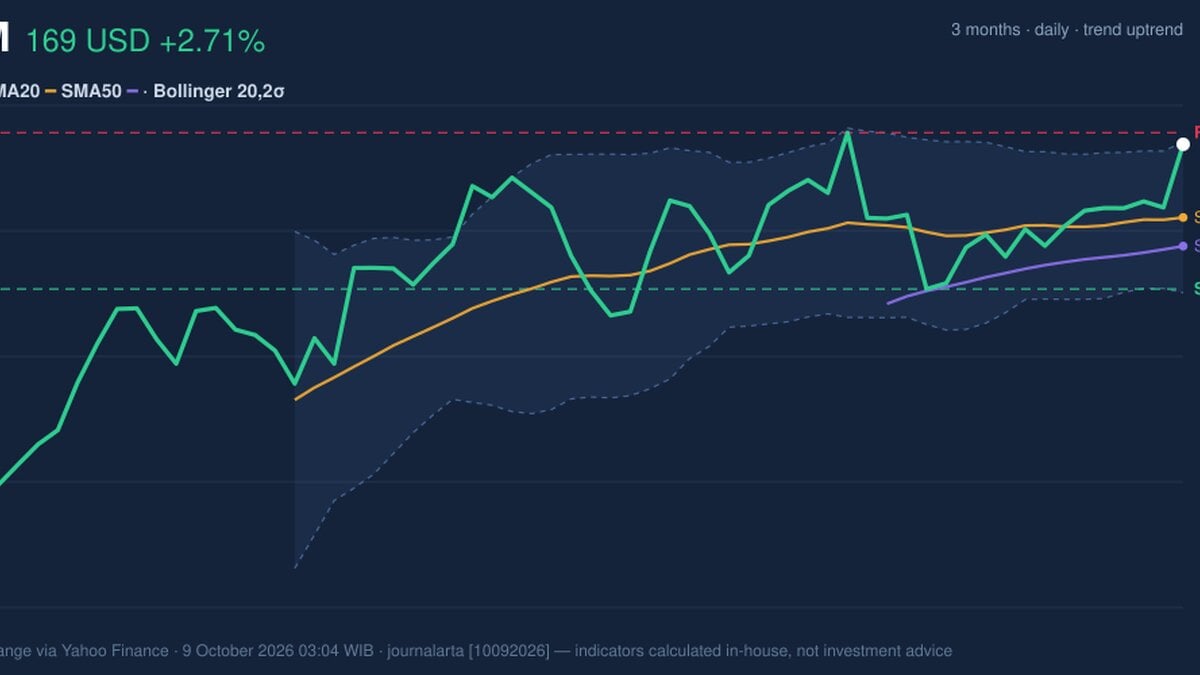
The broader technical structure remains constructive: the price is above both its 20-day simple moving average (SMA), at $163.35, and its 50-day SMA, at $161.33. The 20-day average is rising, up 0.41% over five trading days, while no new crossover between the averages has formed. In plain terms, buyers have kept the shares above recent average levels, but there is no fresh moving-average signal to suggest a decisive change in the longer trend. XOM is now at 93% of its 20-trading-day range, with resistance at $169.32 and support at $158.30. That position says the rally has already covered much of the ground within the recent range; another advance would need to push through nearby resistance rather than merely recover from a low. The three-month high of $169.64 is an additional reference point for whether the stock can extend its climb. As shown in the chart, the price is pressing the upper Bollinger Band at $168.65, while the bands have narrowed to 6.5%. Bollinger Bands measure how far prices are dispersed around a moving average; narrowing often signals a period of reduced range that can precede a larger move, but it does not determine which direction that move will take. XOM’s position near the upper band shows strong near-term price pressure, alongside a risk that momentum may pause if resistance holds.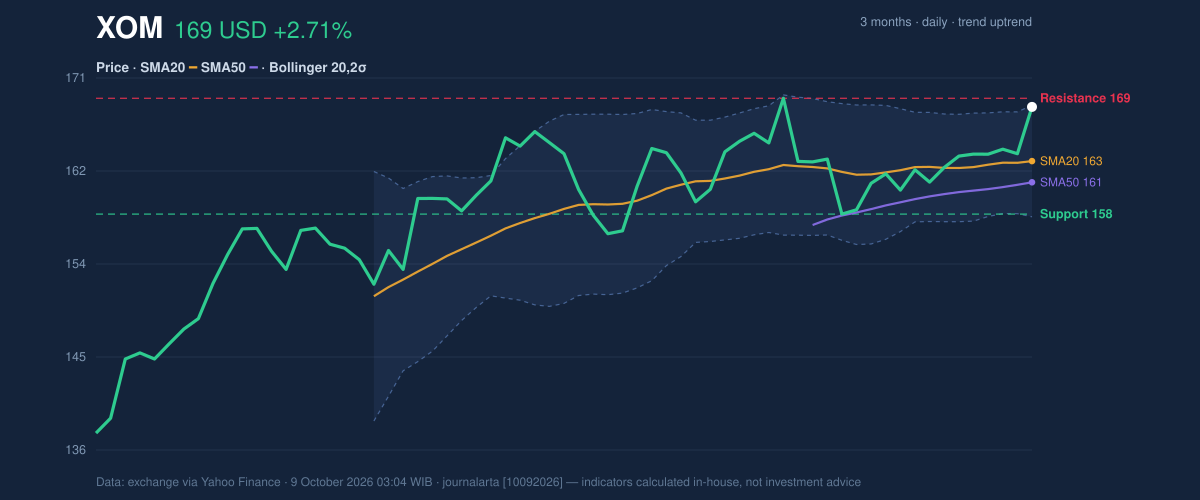
Oscillators & Momentum
Momentum measures broadly support the upward move, though they do not all tell the same short-term story. The RSI is 64.0, in neutral territory: the Relative Strength Index tracks the pace of recent gains and losses, and this reading indicates firm but not yet extreme upward momentum. The MACD is positive at 1.243, above its 0.934 signal line, with a positive 0.309 histogram. That alignment suggests the upward trend still has momentum behind it. The caution comes from the Stochastic reading: %K 94.8 and %D 84.9, in overbought territory. This indicator compares the latest close with the recent price range; a high reading can mean the advance is stretched over the short term, rather than proving an immediate reversal. The combination matters: positive MACD and a neutral RSI favor the trend, while overbought Stochastic warns that a pause or pullback would not be surprising.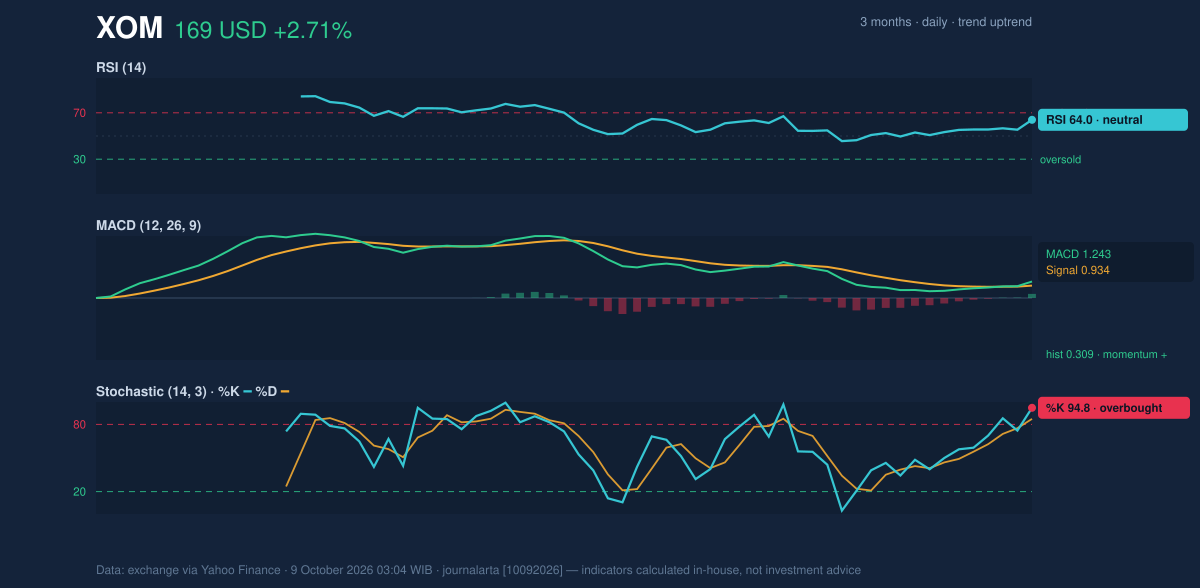
Volatility, Volume & Key Levels
Average True Range (ATR), a measure of typical daily movement, stands at $3.55, or 2.1% of the share price—moderate volatility by this measure. The latest volume was 13,288,100 shares, close to the 20-day average of 13,415,330. The rise therefore came on broadly normal participation, not an unusually large burst of trading; the rising On-Balance Volume (OBV), which tracks whether volume accompanies advances or declines, adds some confirmation that buying interest has been building. The immediate technical test is the $169.32 resistance area, followed by the three-month high at $169.64. A sustained move above those levels would indicate that XOM is escaping its recent range. If the shares fail there, the rising averages at $163.35 and $161.33 offer nearer reference points, while $158.30 is the stated 20-day support. A fall below that support would weaken the current setup.Technical Verdict: HOLD (wait & see)
The indicators point to an established uptrend, but the shares are close to resistance and the Stochastic is overbought. The core signal is positive but not yet a confirmed breakout, so the technical picture supports waiting for clearer evidence at the range ceiling rather than treating the recent gain as confirmation of another leg higher. - Ideal entry range: $163.35–$161.33, around the 20-day and 50-day SMAs. - Exit target: $169.32–$169.64, the stated 20-day resistance and three-month high. - Stop-loss protection: Below $158.30, the 20-day support. - Invalidation: The HOLD verdict is invalidated if the price falls below $158.30. For non-traders, HOLD means the upward trend is intact, but the price is testing a ceiling while short-term momentum looks stretched.Data table
Why XOM is in focus today
- One-day move of 2.71%, about 1.3× its average daily range (ATR)
- Trading near its 3-month high (169.64)
- Uptrend confirmed (5-day change 2.86%)
Selected automatically from 30 NYSE (US) stocks by a technical-signal score with daily weighted randomisation — not a recommendation.
| Indicator | Reading |
|---|---|
| Last price | $168.50 |
| Daily change | +2.71% |
| SMA20 / SMA50 | $163.35 / $161.33 |
| RSI / Stochastic | 64.0 / 94.8 (%K), 84.9 (%D) |
| MACD / signal / histogram | 1.243 / 0.934 / 0.309 |
| ATR | $3.55 (2.1%) |
| 20-day support / resistance | $158.30 / $169.32 |
Summary Data XOM
| Last price | 168.50 USD |
| Change 1 day / 5 days / 1 month | 2.71% / 2.86% / 1.98% |
| Trend / MA-cross | uptrend / none |
| SMA20 / SMA50 | 163.35 / 161.33 |
| RSI (14) / Stochastic %K | 64.0 / 94.8 |
| Bollinger %B / ATR | 99% / 3.55 |
| Support / Resistance 20 days | 158.30 / 169.32 |
| Data as of | 9 October 2026 03:04 WIB |
Disclaimer: This technical analysis is generated automatically from exchange data (via Yahoo Finance) and indicators calculated by JournalArta, for information and education only. The verdict and the entry, target and stop-loss levels are not investment advice or a solicitation to buy or sell any security. Investment decisions and their risks rest solely with the reader.
Track XOM stock price daily: live levels, support/resistance and our full XOM analysis history.