CRM Stock Technicals Today: Gains 4.16%, Testing Key Resistance
On Agustus 14, 2026: price 201.37 USD, trend uptrend, RSI 65.9, support 156.93, resistance 201.37. technical analysis of crm stock. CRM Stock Technicals — full…

Salesforce climbed to 201.37 USD on the NYSE on 13 August 2026, extending a move that has already lifted the stock 4.16% in one day and 16.61% over one month. The share is now trading at the top of its recent range. That matters because the market is no longer pricing CRM as a fading rebound; it is treating the move as a sustained trend, even as short-term signals warn the stock may need to pause before it can push further.
Trend & Price Action
The broader setup remains constructive. Salesforce is trading above its 20-day SMA at 182.28 and well above its 50-day SMA at 172.39, which is the classic sign of an established uptrend. The SMA20 slope of 4.01% over 5 days shows the short-term trend is still rising, not flattening out. In plain English, buyers have been willing to pay progressively higher prices in recent sessions, and that usually signals confidence rather than a one-day squeeze.
There has been no fresh moving-average crossover, so this is not a new technical breakout from a lagging signal. Instead, the trend is being reinforced by price holding above both averages. As shown in the chart, the stock is also pressing against the upper end of its Bollinger structure, which tells us the market has already used up a lot of its near-term upside energy.
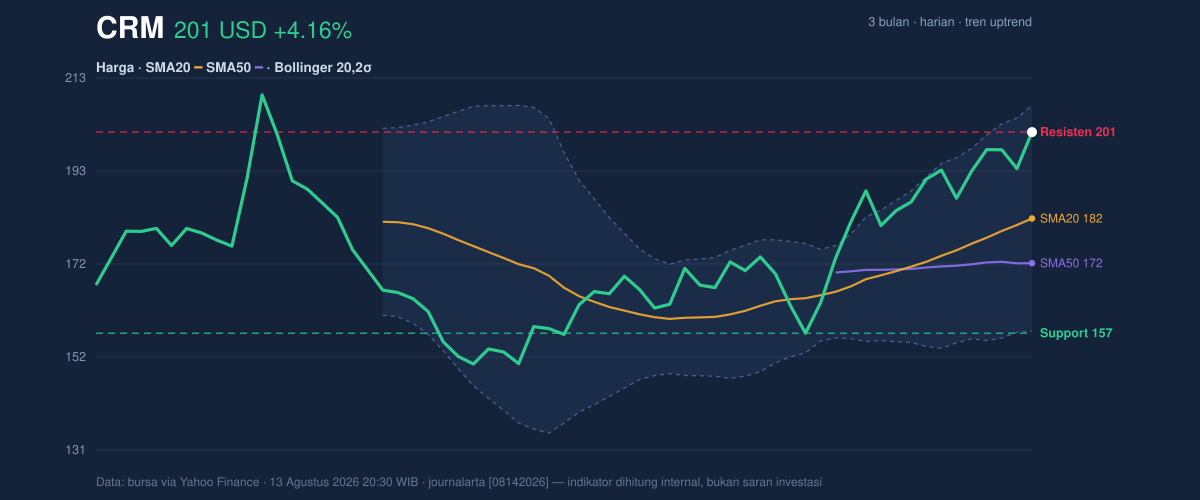
The price is sitting at 100% of the 20-hour range, with 20-hour support at 156.93 and the current price effectively at the ceiling of that band. Over the last three months, CRM has traded between 211.34 and 146.32, so the latest move has carried it back close to the upper part of that broader window. That is a sign of strength, but also a sign that the easy part of the rally may already be behind it for now.
Oscillators & Momentum
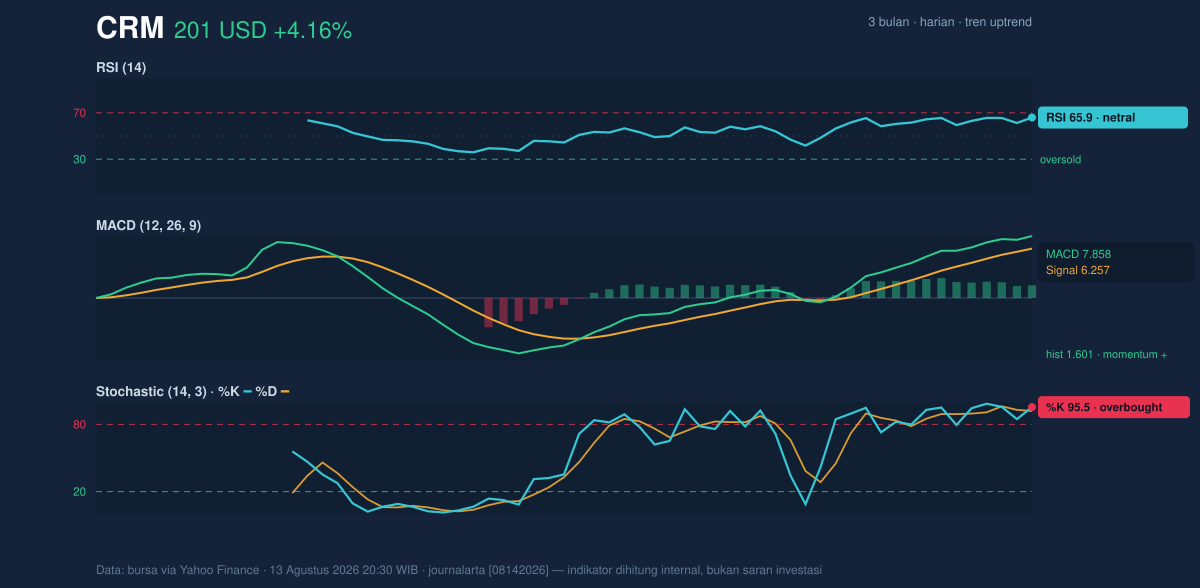
The momentum picture is mixed, and that is the key nuance in CRM right now. RSI at 65.9 is still technically neutral, meaning the stock is not yet in the classic overbought danger zone. But Stochastic %K at 95.5 and %D at 92.0 are both overbought, which usually means the stock has risen fast enough that it may be vulnerable to a short-term pullback or sideways consolidation.
That split matters. RSI is telling us the rally is strong but not exhausted; Stochastic is saying the stock is stretched in the near term. When those two diverge, the market often stays firm, but it becomes less forgiving of bad news or weak guidance.
The trend is still being supported by MACD at 7.858 versus a signal line at 6.257, with a 1.601 histogram. In simple terms, MACD is a measure of whether momentum is accelerating or fading. Here it is still positive, so the trend has not rolled over. As shown in the chart, momentum remains aligned with the uptrend, but it is no longer in a clean, low-stress phase.
Volatility & Volume
Volatility is elevated. The ATR(14) at 8.75, equal to 4.3% of price, means the stock can move sharply even on ordinary sessions. The Bollinger Bands are also widening, with a 27.4% band width, which usually indicates the market is in an expansion phase rather than a quiet range. The %B at 88% shows price is trading close to the upper band at 207.24, leaving less room before the stock reaches a technical stretch point.
This is not a calm, mean-reverting setup. It is a trending one with elevated turbulence. That combination often produces strong follow-through, but it also increases the odds of sharp intraday reversals if momentum cools.
Volume provides partial confirmation. Trading volume of 15,043,700 was about 1.2× normal versus the 20-day average of 12,604,450, and OBV is rising. OBV, or on-balance volume, tracks whether volume is accumulating on up days. Rising OBV suggests the advance is being supported by participation, not just thin trading. That is important because rallies with real volume tend to be more durable than those driven by a narrow group of buyers.
Key Levels & Scenarios
The chart leaves a clear map. Immediate resistance is the current area around 201.37, followed by the Bollinger upper band at 207.24 and the three-month high at 211.34. Support sits first at the 20-day SMA of 182.28, then at the 50-day SMA of 172.39, with deeper support at 156.93 and the three-month low at 146.32.
If CRM can hold above the 20-day average, the trend remains intact and the market can keep testing the upper band and the prior high. If it fails to hold the 20-day SMA, the message changes quickly: the rally would look more like an overextended advance than a durable breakout, and the stock could rotate back toward the 50-day average. The fact that price is already at the top of the short-term range means the next move matters more than the last one.
Technical Verdict: HOLD (wait & see)
HOLD (wait & see)
- MACD is positive, so the broader trend still has momentum behind it.
- Stochastic is overbought and %B is high, which signals the stock is stretched near the top of its band.
- Price is above the 20-day and 50-day SMAs, but it is also sitting at the top of the recent range, so upside confirmation is not yet clean.
Verdict invalidated if price breaks below 182.28.
- Ideal Entry Range: 182.28 to 172.39
- Exit Target: 207.24 to 211.34
- Stop Loss protection: 156.93
For non-traders, this means the stock still looks strong, but it is already extended enough that the next move should confirm whether the rally has more room or needs a reset.
The latest three-month high for Salesforce is 211.34 USD.
Summary Data CRM
| Last price | 201.37 USD |
| Change 1 day / 5 days / 1 month | 4.16% / 7.82% / 16.61% |
| Trend / MA-cross | uptrend / none |
| SMA20 / SMA50 | 182.28 / 172.39 |
| RSI (14) / Stochastic %K | 65.9 / 95.5 |
| Bollinger %B / ATR | 88% / 8.75 |
| Support / Resistance 20 days | 156.93 / 201.37 |
| Data as of | 13 Agustus 2026 20:30 WIB |



