AAPL Testing Support Level: Stock Gains 0.11% (Agustus 18, 2026)
On Agustus 18, 2026: price 305.59 USD, trend sideways, RSI 43.7, support 302.25, resistance 340.08. technical analysis of aapl stock. AAPL Testing Support…

Apple shares were little changed on NASDAQ, with AAPL last at 305.59 USD, up 0.11% from the previous close of 305.26. The small daily move, however, sits inside a broader soft patch: the stock is down 2.47% over 5 days and 8.43% over 1 month, a combination that tells traders the latest bounce has not yet reversed the larger slide.
Trend & Price Action
The chart shows a stock that is still leaning lower inside a sideways structure. Price remains below the 20-day SMA at 318.43 and also below the 50-day SMA at 309.19, which matters because moving averages often act like dynamic trend lines: when price trades under them, rallies tend to face selling pressure as holders use strength to reduce exposure. The SMA20 slope is -1.55% over 5 days, so the short-term trend is not accelerating downward sharply, but it is still drifting lower rather than turning up.
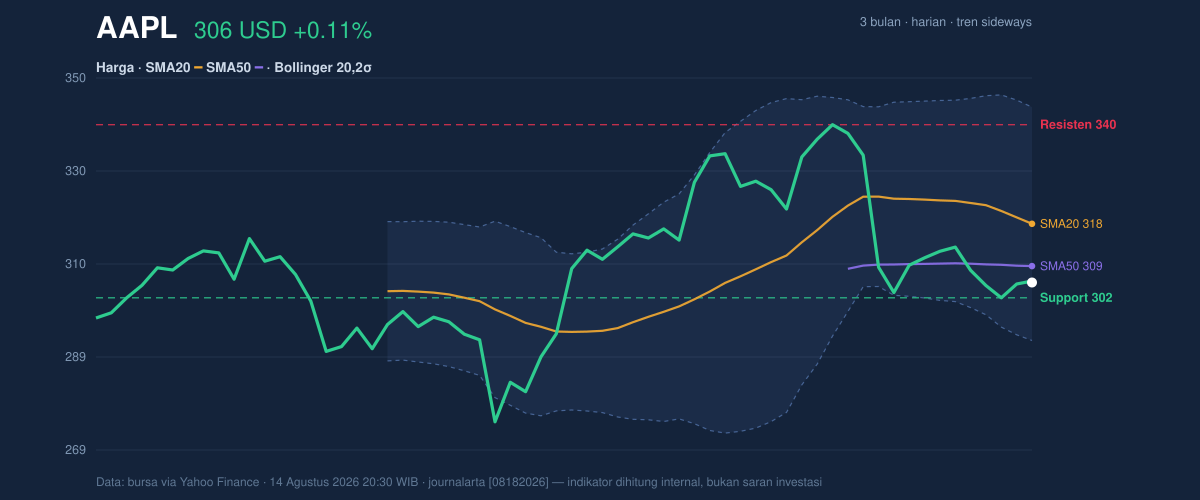
The absence of a fresh MA-cross is also telling. A new cross between shorter and longer averages can mark a change in trend; without one, the market is more likely consolidating after a decline than starting a clean reversal. Apple is trading near the lower half of its recent range, with price at 9% of the 20-hour range between support at 302.25 and resistance at 340.08. That positioning says the market is closer to the floor than the ceiling, but not yet at a level where buyers have clearly taken control.
The three-month range adds context. The stock’s 3-month high is 344.57 and the 3-month low is 273.75. With the latest price sitting well below the upper end of that band, the market is still working through a correction rather than trading near breakout territory.
Oscillators & Momentum
Momentum signals are mixed, and that mix is important. RSI at 43.7 is neutral, which means the stock is neither stretched upward nor deeply washed out on this measure. In plain language, RSI is the market’s speedometer: around the middle, it suggests no strong trend energy either way. That neutrality is not the same as strength, though; it simply means the stock is not yet overextended.
The more interesting signal is the short-term oscillator setup. Stochastic %K at 13.3 and %D at 10.1 are oversold, which indicates the stock has been under pressure enough that it may be vulnerable to a reflex bounce. Oversold does not mean cheap in a fundamental sense; it means recent closes have been sitting near the bottom of their recent trading range. That often happens when sellers have already pushed hard and the next move can be a pause or rebound.
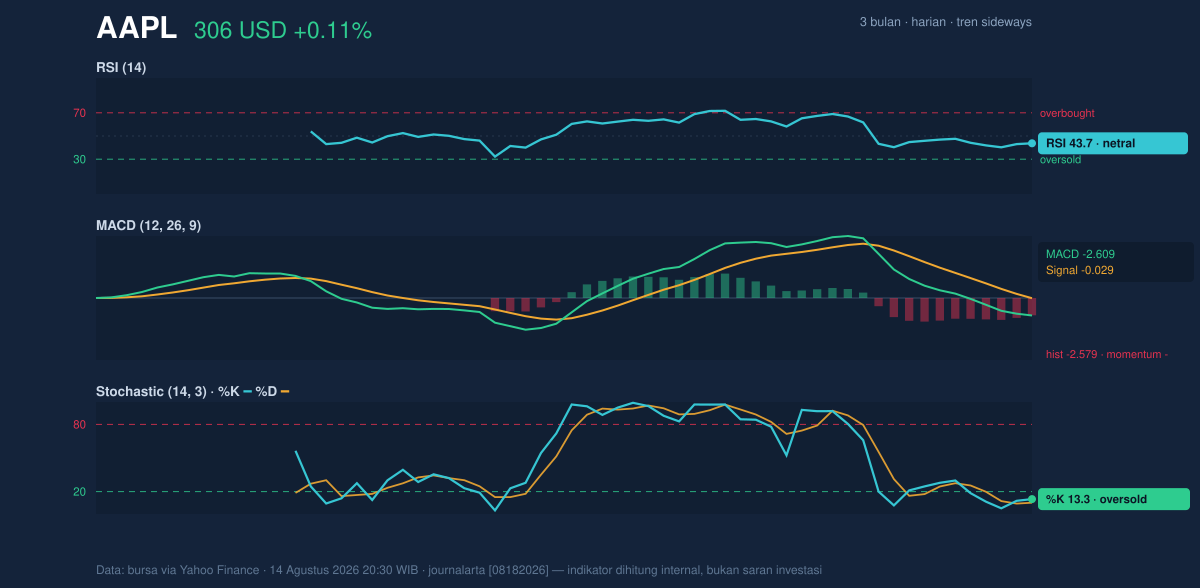
But the MACD does not confirm a turn yet. MACD at -2.609, with the signal line at -0.029 and a histogram of -2.579, shows negative momentum still dominating. MACD is a trend-following gauge, so a negative reading below the signal line usually means downside force remains in place. In other words, the oversold stochastic hints at a possible bounce, but MACD says the broader momentum backdrop is still bearish.
Volatility & Volume
Volatility is present, but not extreme. ATR at 8.58, or 2.8% of price, points to moderate daily movement, which matters because it suggests the stock can still travel meaningfully in either direction without a major volatility shock. The Bollinger Band width is 16.0% and described as normal, so this is not a squeeze that typically precedes a sharp expansion, nor is it a panic-like widening. The price is sitting near the lower side of the band structure, with %B at 25%; that means the stock is trading closer to the lower Bollinger Band at 292.93 than the upper band at 343.93. That placement often reflects weakness, but it can also mark an area where selling pressure starts to become less efficient.
Volume gives a different clue. Last volume was 28,229,400, well below the 20-hour average of 52,617,430, or about 0.5x normal. Thin participation on a down-leaning stock usually weakens the case for a decisive breakout lower, because major moves tend to be easier to sustain when more shares are changing hands. At the same time, OBV is rising, and that is the one constructive divergence in the data: on-balance volume tracks whether money flow is quietly favoring accumulation. Rising OBV while price remains soft can mean buyers are beginning to absorb supply even before the chart itself turns.
Key Levels & Scenarios
The market has a clear map. Support at 302.25 is the first level to watch, and a failure there would expose the lower Bollinger Band at 292.93. If that lower band gives way, the chart would likely shift from correction mode into a more fragile technical posture. On the upside, resistance at 340.08 lines up near the upper part of the recent range and below the 3-month high of 344.57. A move through that zone would matter because it would show the stock has reclaimed the upper half of its trading range and is no longer just bouncing from oversold conditions.
The key signal is that Apple is not breaking down with heavy volume, but it is also not reclaiming trend control. The setup is therefore one of waiting for confirmation rather than assuming the oversold reading will automatically turn into a durable reversal. Price below both major moving averages, negative MACD, oversold Stochastic, and rising OBV together point to a market that is weak but not yet in full capitulation.
Technical Verdict: HOLD (wait & see)
HOLD (wait & see)
- Reason 1: Price is below SMA20 at 318.43 and SMA50 at 309.19, so the trend structure has not yet reclaimed the averages that often define control.
- Reason 2: MACD is negative at -2.609, showing momentum is still tilted lower despite the oversold Stochastic reading.
- Reason 3: OBV is rising while volume is only 0.5x average, suggesting quiet accumulation may be building, but not enough to confirm a turn.
- Verdict invalidated if price breaks below 302.25, because that would weaken the nearest support and raise the risk of a move toward 292.93.
- Ideal Entry Range: 302.25 to 309.19
- Exit Target: 318.43 to 340.08
- Stop Loss protection: below 292.93
In plain English: the stock looks tired, but the chart has not yet proved that the weakness is over.
Summary Data AAPL
| Last price | 305.59 USD |
| Change 1 day / 5 days / 1 month | 0.11% / -2.47% / -8.43% |
| Trend / MA-cross | sideways / none |
| SMA20 / SMA50 | 318.43 / 309.19 |
| RSI (14) / Stochastic %K | 43.7 / 13.3 |
| Bollinger %B / ATR | 25% / 8.58 |
| Support / Resistance 20 days | 302.25 / 340.08 |
| Data as of | 14 Agustus 2026 20:30 WIB |


