XOM Stock Gains 0.56% Today, Momentum Weakens
On September 25, 2026: price 162.14 USD, trend sideways, RSI 51.4, support 156.44, resistance 169.32. technical analysis of xom stock. XOM Stock Gains — full…

ExxonMobil traded at 162.14 USD on the NYSE on 24 September 2026, edging 0.56% higher from the previous close while still sitting just under its short-term average, a setup that leaves the shares in a cautious holding pattern rather than a clean breakout. The stock is moving inside a sideways structure, and that matters: it signals that buyers and sellers are still roughly balanced even after a modest one-day gain, with the market waiting for a stronger catalyst to decide direction.
Trend & Price Action
The most important read from the chart is that ExxonMobil is trading below SMA20 at 162.25 but above SMA50 at 158.85. That placement usually means the shares have not lost their medium-term footing, yet they also have not regained enough near-term strength to call the short-term trend firmly positive. In plain English, the stock is hovering in the middle of its recent range, which often produces choppy trading until price escapes one side of the band.
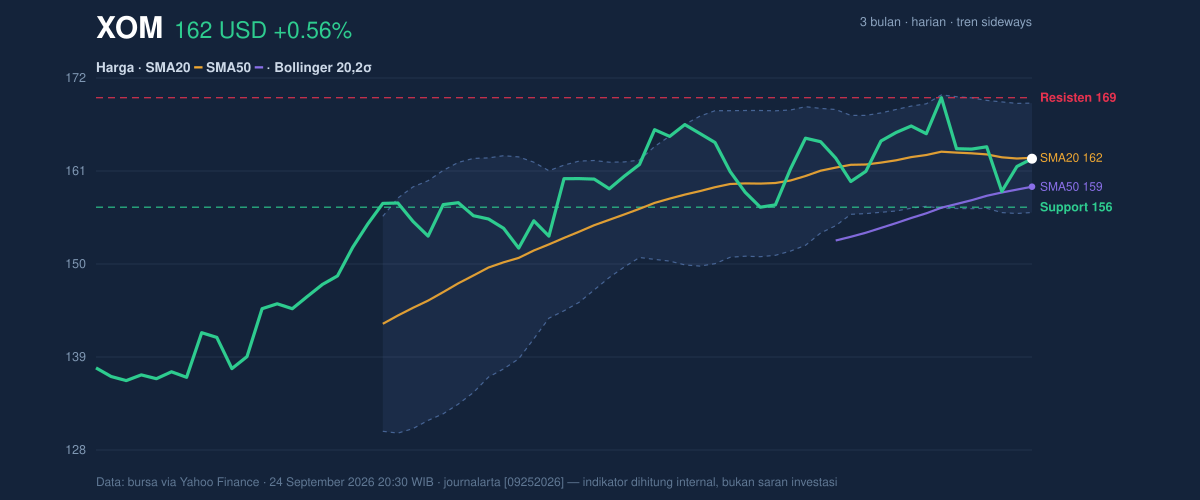
The lack of a fresh MA-cross also reinforces that message. A moving-average cross is a trend-change signal, and the absence of one suggests the market has not yet committed to a new direction. The Bollinger Band structure adds another layer: the upper band is 168.68, the middle line is 162.25, and the lower band is 155.81. With price at 44% of the 20-hour range and band width at 7.9%, the chart is showing a squeeze, or tightening price action, which often precedes a larger move. Tight bands do not predict direction by themselves, but they do warn that the next swing could be sharper than recent trading.
The broader range confirms that view. ExxonMobil is still below the 3-month high of 169.64 but well above the 3-month low of 134.95, which means the stock is not in a panic phase and not in a strong trend phase either. It is sitting in the middle ground where technical signals can flip quickly if volume expands.
Oscillators & Momentum
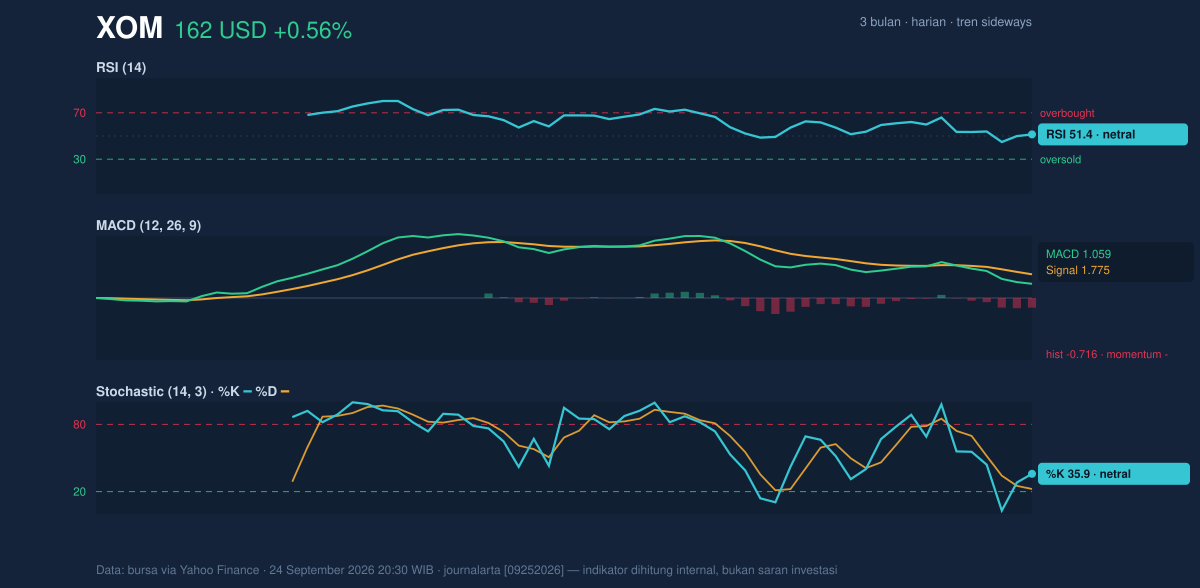
Momentum indicators are mixed, and that is the key message. The RSI at 51.4 is neutral, so the stock is neither overbought nor oversold. That usually means there is no immediate momentum exhaustion, but also no strong trend thrust. The Stochastic %K at 35.9 and %D at 22.4 are also neutral, though the lower %D line suggests the short-term bounce has not yet fully matured into a strong upside signal.
The more cautionary reading comes from MACD. The MACD at 1.059 is below the signal line at 1.775, and the histogram at -0.716 is negative. That combination tells the market’s recent momentum is still weaker than its slower trend baseline. In practical terms, traders are seeing a stock that can rise on a day, but has not yet generated the internal force needed to sustain a stronger advance. The RSI and Stochastic being neutral while MACD remains negative is a classic sign of hesitation rather than conviction.
Volatility & Volume
Volatility is moderate, not extreme. The ATR(14) at 4.05, or 2.5% of price, suggests ExxonMobil can move enough to matter in a short session, but not in a disorderly way. Combined with the Bollinger squeeze, that points to a market coiling rather than trending aggressively. When volatility compresses like this, the next move can be more directional, but the chart still needs confirmation from price and participation.
Volume tells a subtler story. Last trade volume was 12,469,500, below the 20-hour average of 14,715,005, or about 0.8× normal. That means the recent uptick was not powered by broad participation, which weakens the significance of the gain. Still, OBV is rising, and that matters because On-Balance Volume tracks whether money is flowing into the stock over time. Rising OBV alongside a flat price often suggests accumulation beneath the surface, even if the market has not yet confirmed it with a breakout.
Key Levels & Scenarios
The nearest levels are clear. Support at 156.44 is the first line the market will likely test if the stock loses its current balance, while resistance at 169.32 caps the near-term upside and sits just under the 3-month high of 169.64. Because price is currently only modestly above the middle of the range, the chart is vulnerable to either a rejection near resistance or a drift back toward support if momentum stays weak.
A sustained move above 169.32 would matter because it would place the stock through the recent ceiling and likely confirm that the Bollinger squeeze is resolving upward. By contrast, a fall back through 156.44 would signal that the current base is failing and that the market is rotating toward the lower band near 155.81. That would also make the negative MACD read more important, because price would then be aligning with weaker momentum rather than resisting it.
Technical Verdict: HOLD (wait & see)
HOLD (wait & see) fits the current setup because the stock is trapped between a firm medium-term base and a weak short-term momentum profile. The strongest reasons are: price is below SMA20 but above SMA50, which points to mixed trend structure; MACD histogram is negative, showing momentum is still lagging; and Bollinger Bands are squeezing, which suggests a larger move may be forming but not yet confirmed. The verdict is invalidated if price breaks below 156.44, because that would weaken the current range support and shift the technical balance toward a more defensive posture.
- Ideal entry range: 156.44 to 162.25, where support and the Bollinger middle band overlap
- Exit target: 169.32 to 169.64, matching resistance and the 3-month high area
- Stop loss protection: below 155.81, the lower Bollinger band, or beneath 156.44 if support fails first
In plain English: ExxonMobil looks steady but not yet decisive, and the next meaningful move is likely to come only after the stock leaves this tight trading band.
Summary Data XOM
| Last price | 162.14 USD |
| Change 1 day / 5 days / 1 month | 0.56% / -0.72% / 0.93% |
| Trend / MA-cross | sideways / none |
| SMA20 / SMA50 | 162.25 / 158.85 |
| RSI (14) / Stochastic %K | 51.4 / 35.9 |
| Bollinger %B / ATR | 49% / 4.05 |
| Support / Resistance 20 days | 156.44 / 169.32 |
| Data as of | 24 September 2026 20:30 WIB |


