BAC Stock Analysis: Gains 1.20%, Testing Support Level
On September 28, 2026: price 56.70 USD, trend downtrend, RSI 31.0, support 56.00, resistance 63.04. technical analysis of bac stock. BAC Stock Analysis — full…

Bank of America is trying to steady itself after a month-long slide, but the chart still says sellers have the upper hand for now. On the New York Stock Exchange, BAC last traded at 56.70 USD, up 1.20% from the previous close of 56.03, yet that bounce sits inside a broader downtrend that has been building for weeks.
Trend & Price Action
The main signal is not the one-day gain; it is where the stock sits relative to its moving averages. BAC remains below the SMA20 at 60.03 and below the SMA50 at 61.54, which means the short-term and medium-term trend are both still leaning lower. The SMA20 is sloping down 2.20% over 5 days, a sign that recent weakness is still feeding into the trend rather than fading.
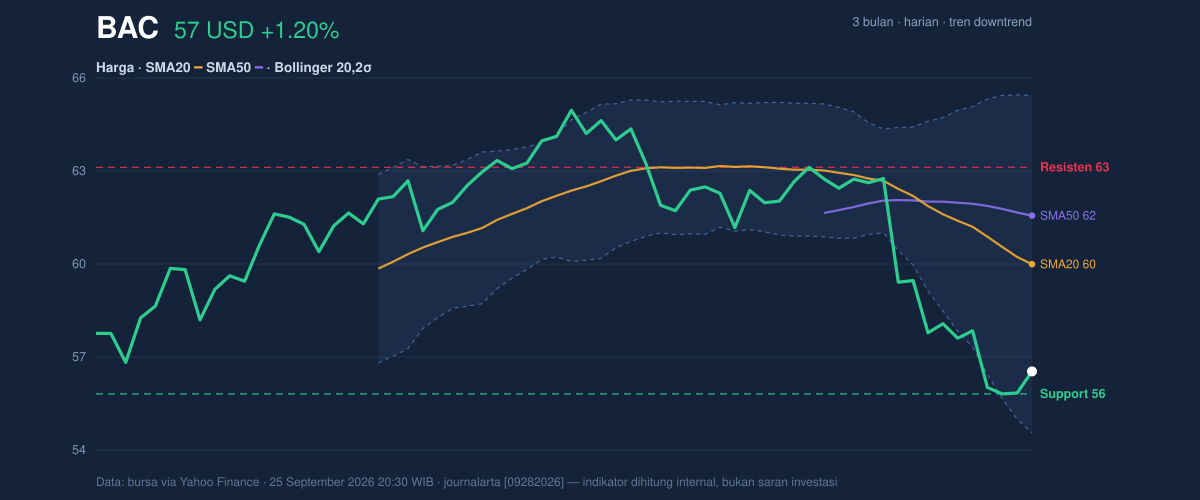
As shown in the chart, price is also positioned in the lower part of its recent trading band. The stock is only modestly above the 20-hour support at 56.00, while the 20-hour resistance stands at 63.04. That places BAC near the bottom of its 20-hour range, which tells readers the market is still treating rallies as something to fade unless buyers can reclaim higher ground.
The three-month range adds context. BAC is trading above the 3-month low of 55.74 but still below the 3-month high of 65.23. In plain language, the stock is not in free fall, but it is also not showing the kind of strength that usually marks a durable reversal.
Oscillators & Momentum
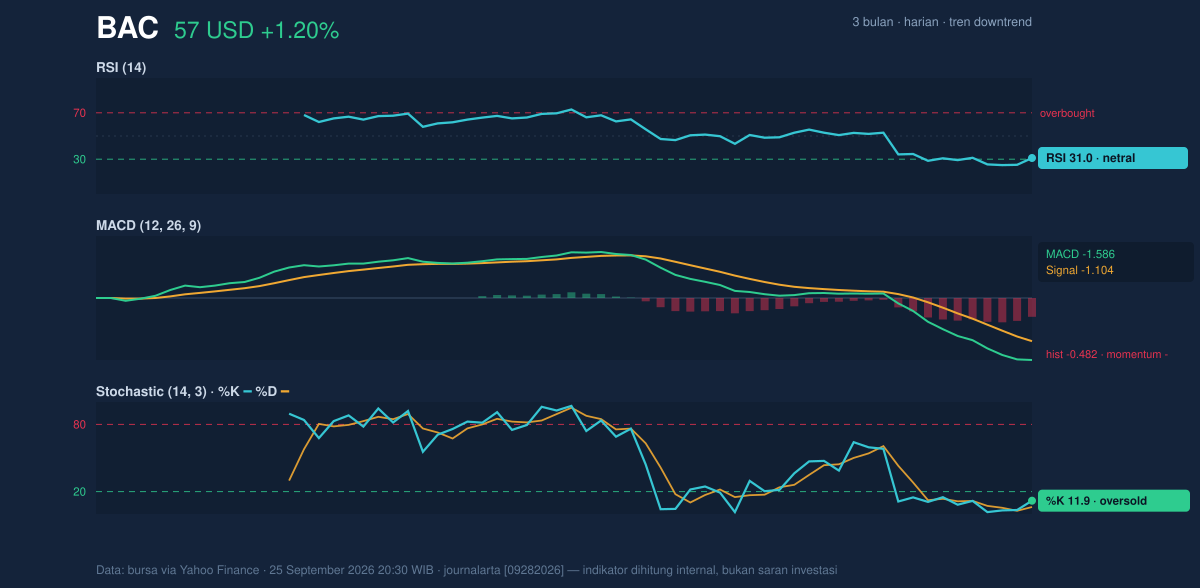
The momentum tools are mixed, and that mix matters. The RSI at 31.0 is close to the oversold zone, which often means the stock has already been sold hard enough to begin attracting bargain hunters. But RSI is not a reversal signal on its own; it only says the decline may be stretched.
The Stochastic reading of 11.9 / 6.2 is oversold, and that is a more immediate sign that the recent selloff may be tiring. Stochastic tends to move faster than RSI, so when it reaches this area it often shows short-term pressure has become one-sided. Still, oversold can stay oversold in a downtrend.
That caution is reinforced by the MACD at -1.586, with the signal line at -1.104 and the histogram at -0.482. This is a clear negative momentum setup: the MACD line remains below the signal line, and the negative histogram shows the downtrend still has force behind it. In practical terms, momentum is not confirming the small daily bounce yet.
Volatility & Volume
The Bollinger Bands provide a useful frame for how stretched the move is. BAC is trading near the lower band, with %B at 18%, meaning price is sitting close to the bottom of the band structure rather than the middle. That usually signals weakness, but it can also hint at a short-term exhaustion point if buyers start to defend the area.
The band width is 17.5%, described as normal, so this is not a volatility squeeze waiting to explode. Instead, the setup suggests an ordinary trading environment with enough room for continued swings, and the ATR(14) of 1.35 — about 2.4% of price — confirms volatility is moderate rather than extreme. That matters because moderate ATR can allow a stock to drift lower without dramatic panic, which is often how downtrends persist.
Volume does not yet support a bullish read. Last volume was 28,586,200, below the 20-hour average of 37,462,440, or 0.8x normal. When a rebound comes on lighter turnover, it often means conviction is limited. The OBV is falling, which is important because OBV tracks whether volume is flowing into or out of the stock; a declining OBV means distribution is still outweighing accumulation.
Key Levels & Scenarios
The nearest line in the sand is the 56.00 support. BAC is hovering just above it, so this level is doing real work as a short-term floor. If that support holds, the stock could attempt to stabilize and test the middle of the Bollinger structure near 60.03, which is also the SMA20 and therefore a key trend checkpoint.
If price can reclaim 60.03 and then push toward 61.54, the market would begin to question the current downtrend. A move through those averages would not erase the damage, but it would show that buyers are no longer confined to defensive trading.
If instead BAC slips back under 56.00, the chart would be pointing back toward the 55.74 three-month low. That would keep the recent bounce looking like a pause inside a larger decline rather than the start of a recovery.
Technical Verdict: HOLD (wait & see)
HOLD (wait & see)
- MACD remains negative, so downside momentum is still in place.
- Price is below SMA20 and SMA50, which keeps the trend structure bearish.
- RSI and Stochastic are oversold, hinting at a possible short-term bounce, but not yet a confirmed reversal.
Verdict invalidated if price falls below 56.00; that would expose the 55.74 low and strengthen the bearish case.
- Ideal entry range: 56.00 to 60.03, where support and the SMA20 overlap.
- Exit target: 60.03 to 61.54, the first recovery zone at the middle band and SMA50.
- Stop loss protection: below 55.74, the three-month low.
For non-traders, this means BAC is cheap enough to attract attention, but the chart has not yet proved that the decline is over.
Summary Data BAC
| Last price | 56.70 USD |
| Change 1 day / 5 days / 1 month | 1.20% / -1.78% / -7.31% |
| Trend / MA-cross | downtrend / none |
| SMA20 / SMA50 | 60.03 / 61.54 |
| RSI (14) / Stochastic %K | 31.0 / 11.9 |
| Bollinger %B / ATR | 18% / 1.35 |
| Support / Resistance 20 days | 56.00 / 63.04 |
| Data as of | 25 September 2026 20:30 WIB |

