BAC Stock Gains 0.36% Today, Testing Key Resistance
On Agustus 3, 2026: price 61.95 USD, trend uptrend, RSI 62.1, support 58.30, resistance 62.62. technical analysis of bac stock. BAC Stock Gains — full details…

Bank of America’s shares are pressing near the top of their recent range, but the latest indicators suggest the move still needs confirmation from trading volume and momentum. On the NYSE, BAC last changed hands at 61.95 USD, up 0.36% on the day, with the stock still up 5.48% over one month even after a slightly softer -0.16% showing over five days.
Trend & Price Action
The broad picture remains constructive. BAC is trading above its SMA20 at 60.88 and well above its SMA50 at 57.25, which tells readers that the shorter-term trend is still leading the longer one, a classic sign of an established uptrend rather than a stalled rebound. The uptrend label is reinforced by the SMA20 slope of 1.64% over five days, meaning the average price itself is still rising, not flattening out.
That matters because price is not just above support; it is sitting close to the upper end of its recent trading band. As shown in the chart, BAC is at 84% of its 20-hour range, with 58.30 as support and 62.62 as resistance. In plain terms, the market has already done much of the work on the upside, so fresh gains may need either stronger participation or a clean push through resistance to continue cleanly.
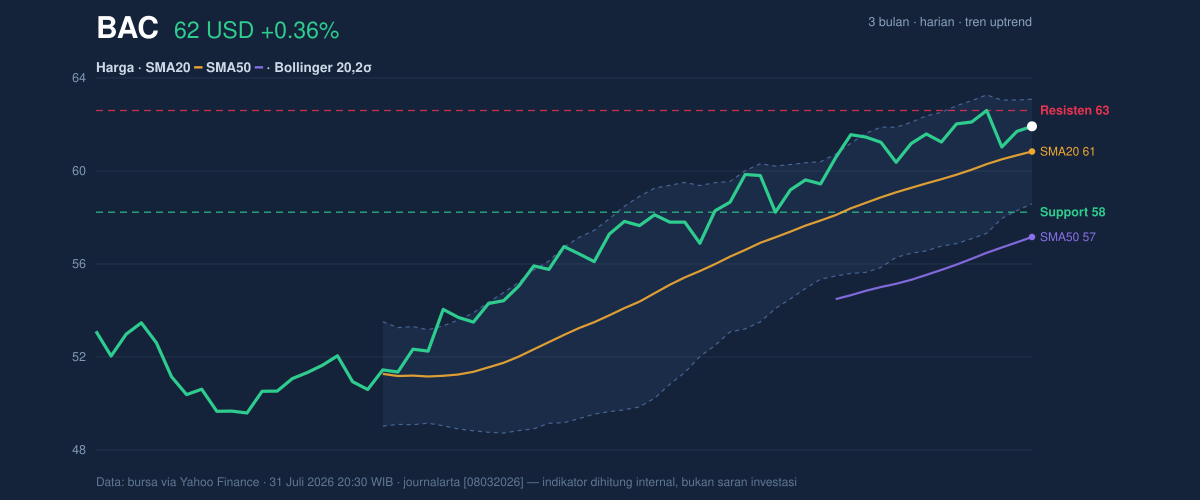
The stock is also trading just below its 3-month high of 62.99, which is important because markets often pause near prior highs as earlier buyers decide whether to take profits. A close above that zone would signal that BAC is not merely drifting upward inside a range, but trying to extend into new territory.
Oscillators & Momentum
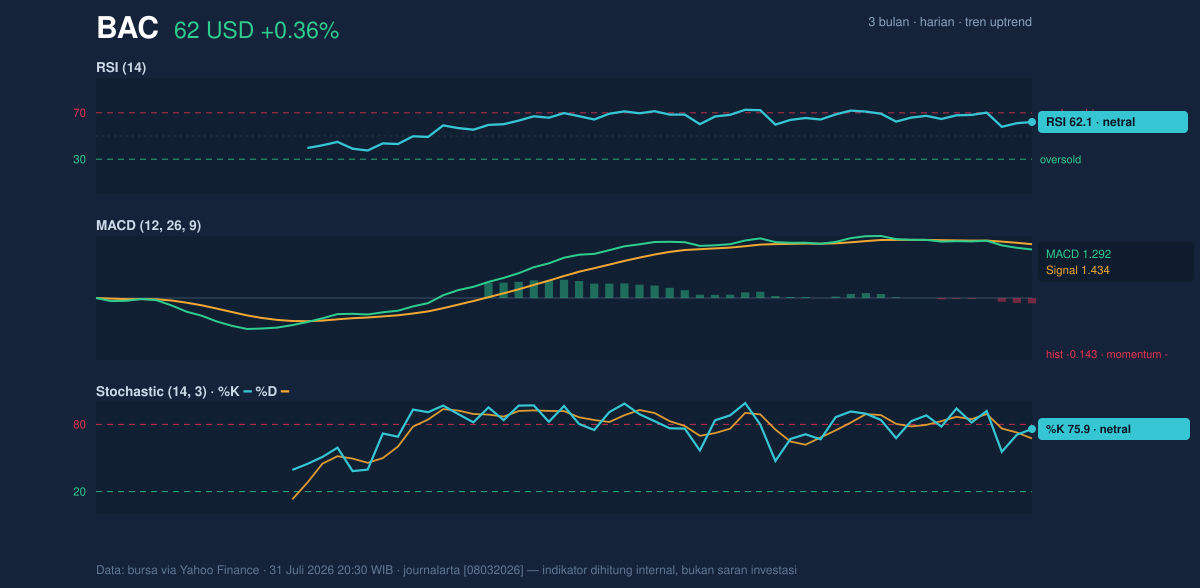
Momentum is more mixed than the trend. The RSI at 62.1 is best read as neutral-to-firm: it shows the stock has strength, but not the kind of overheated reading that usually precedes an immediate reversal. The Stochastic %K at 75.9 and %D at 67.4 point to the same idea — BAC is near the upper part of its short-term momentum band, but not yet at a level that screams exhaustion.
The more cautious signal comes from MACD. The MACD at 1.292 remains positive, which means the trend structure is still intact, but it is below the signal line at 1.434 and the histogram at -0.143 shows momentum is currently negative. That combination often means the uptrend is still alive, yet the pace of advance has slowed. For non-specialists, this is the market’s way of saying price is holding up better than momentum is — a warning sign, not a breakdown.
Volatility & Volume
The Bollinger Bands add another layer. BAC’s %B at 74% places the stock in the upper part of the band structure, which is consistent with strength but also suggests less room before the upper band at 63.10 comes into play. More interesting is the 7.3% band width, described here as a squeeze. A squeeze means volatility has narrowed; when that happens near resistance, the market often builds pressure for a larger move, though the direction is not guaranteed.
ATR helps frame the likely scale of that move. The ATR(14) at 1.21, equal to 1.9% of price, indicates moderate day-to-day movement rather than a highly erratic stock. That supports a view of controlled trading rather than a disorderly breakout attempt.
Volume is the missing piece. The latest volume of 27,282,600 is only 0.8x normal compared with the 20-hour average of 33,786,600. In practical terms, BAC is climbing without full market conviction. The fact that OBV is rising softens that concern because on-balance volume tracks whether money is broadly accumulating or leaving the stock. Rising OBV says buyers have been present over time, even if the latest session did not show heavy turnover.
Key Levels & Scenarios
The immediate battleground is clear. 62.62 is the first resistance to watch, and 63.10 is the Bollinger upper band that can act like a short-term ceiling. Above that sits the 3-month high at 62.99, which effectively marks the edge of the recent range and a reference point for whether the stock is expanding or simply hovering near the top.
On the downside, 60.88 is the SMA20 and also the Bollinger middle band, so it is the first meaningful pivot if the stock loses momentum. Below that, 58.66 is the lower Bollinger band, while 58.30 is the stated support. A break under that zone would imply BAC is no longer just pausing near highs but starting to unwind the recent advance.
Technical Verdict: HOLD (wait & see)
HOLD (wait & see)
- Trend support is intact: price is above the SMA20 at 60.88 and SMA50 at 57.25, with the SMA20 slope still rising.
- Momentum is not fully confirming: MACD is below its signal line and the histogram is negative, even though RSI at 62.1 and Stochastic at 75.9/67.4 remain constructive.
- Volatility is compressing near resistance: the Bollinger squeeze hints at a bigger move, but volume is only 0.8x normal, so the breakout case is not yet strongly validated.
- Verdict invalidated if price falls below 58.30.
- Ideal Entry Range: 60.88 to 61.95
- Exit Target: 62.62 to 63.10
- Stop Loss protection: 58.66 to 58.30
In plain English: BAC still looks firm, but the market has not yet shown enough momentum and volume to prove the next leg higher.
Summary Data BAC
| Last price | 61.95 USD |
| Change 1 day / 5 days / 1 month | 0.36% / -0.16% / 5.48% |
| Trend / MA-cross | uptrend / none |
| SMA20 / SMA50 | 60.88 / 57.25 |
| RSI (14) / Stochastic %K | 62.1 / 75.9 |
| Bollinger %B / ATR | 74% / 1.21 |
| Support / Resistance 20 days | 58.30 / 62.62 |
| Data as of | 31 Juli 2026 20:30 WIB |


