OCBC Stock Analysis: Gains 0.66%, Testing Key Resistance
On September 29, 2026: price 32.22 SGD, trend uptrend, RSI 61.5, support 31.00, resistance 32.27. technical analysis of ocbc stock. OCBC Stock Analysis — full…

OCBC Bank edged up to 32.22 SGD on SGX, extending a short-term advance that has left the counter trading near the top of its recent band, while the chart also shows signs that the move may be running into technical resistance. The stock is still in an uptrend, but the latest signals are mixed: price is above key moving averages, yet momentum gauges are no longer confirming the climb with the same force.
Trend & Price Action
As shown in the chart, OCBC is trading above its SMA20 at 31.66 and above its SMA50 at 30.76, which keeps the medium-term structure constructive. The fact that the price is above the SMA20 matters because it suggests recent buying has been strong enough to keep the stock above its short-term average cost base.
The slope of the SMA20 is also positive at 0.51% over five days, reinforcing that the trend is still pointing higher rather than flattening out. But there is an important nuance: there is no new MA-cross, so this is not a fresh moving-average breakout story. It is more a continuation of an existing trend, which usually carries less surprise value than a new crossover.
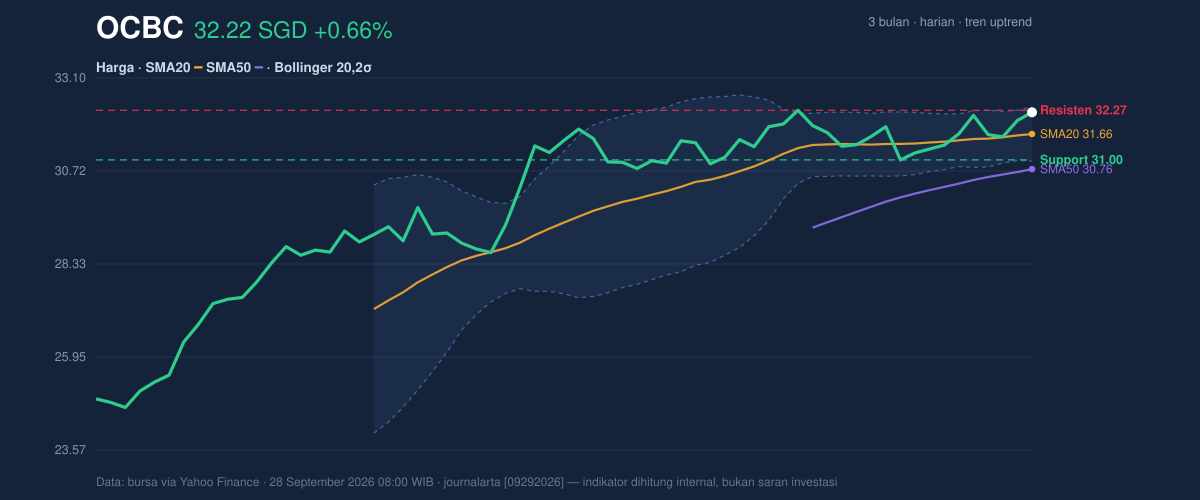
Price is also sitting very close to the upper end of its recent range, with support at 31.00 and resistance at 32.27. At 32.22, the stock is trading at roughly 96% of the 20-hour range, which signals that most of the near-term upside room has already been used. The 3-month high at 32.57 is now the next obvious reference point, while 24.65 remains the distant low that defines the broader recovery arc.
The Bollinger Bands add another layer to that picture. The upper band sits at 32.36, and price is already pressing close to it, with %B at 90%. That reading means the stock is trading near the top of its volatility envelope, often a sign that the market is stretched in the short term. The band width has narrowed to 4.4%, and that squeeze suggests compression rather than expansion; in plain English, the stock is coiling, and a larger move could follow once the current pause resolves.
Oscillators & Momentum
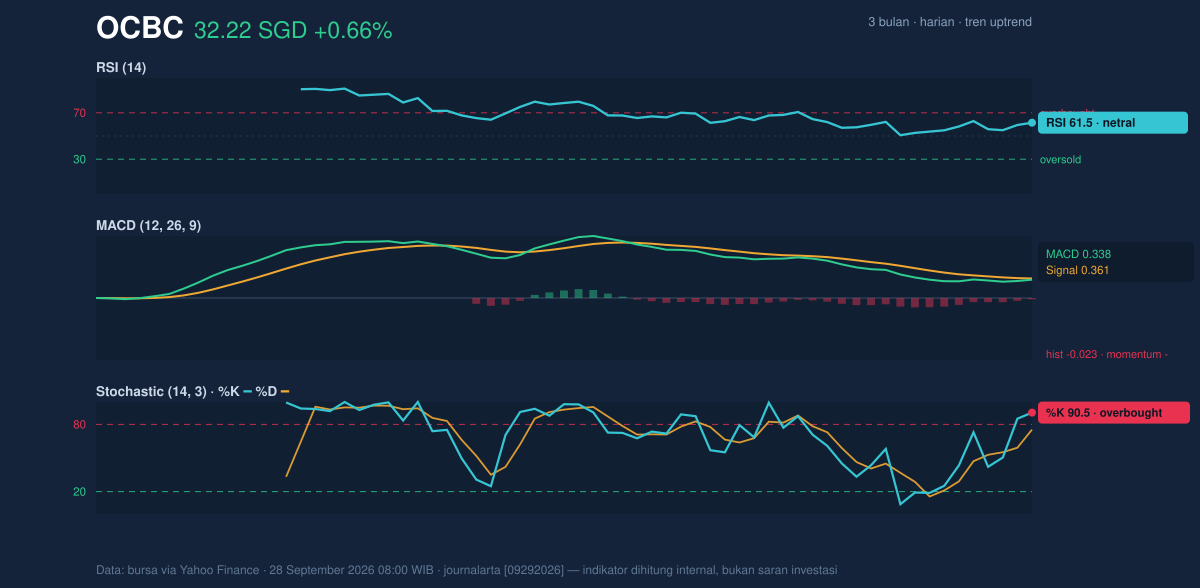
Momentum is where the story becomes more cautious. The RSI at 61.5 is still in neutral territory, so the stock is not technically overbought on that measure. However, the Stochastic %K at 90.5 and %D at 75.3 are both elevated, with %K firmly in overbought territory. That tells readers the latest push higher has been fast and somewhat extended, even if it has not yet fully reversed.
The MACD is less supportive. With MACD at 0.338 versus a signal line at 0.361, and a histogram of -0.023, the momentum engine is slightly negative. This does not mean the trend has broken. It does mean the pace of ascent has slowed enough that the shorter-term momentum line has slipped below its signal, which often happens when a stock pauses after a run-up.
Put together, the oscillators are not in full agreement. RSI says the stock is still in a workable zone, Stochastic says it is stretched, and MACD says momentum has cooled. That kind of mixed alignment is typical when a stock is near resistance and volatility is compressed.
Volatility & Volume
Volatility is subdued. The ATR at 0.48, equal to 1.5% of price, indicates relatively low day-to-day movement. That matters because a low ATR near resistance often means the market is waiting for a catalyst rather than committing to a sharp directional move.
Volume also tempers enthusiasm. The latest turnover was 4,771,000, below the 20-day average of 5,702,917, or about 0.8× normal. In technical terms, that means the latest advance has not been backed by especially strong participation. A rally on lighter volume can still continue, but it is less convincing than one driven by heavy trading.
That said, the OBV is rising, which is an encouraging sign. OBV, or on-balance volume, tracks whether volume is accumulating on up days or fading on down days. A rising OBV suggests buyers have been more active than sellers over time, even if the most recent session was not heavy. So the volume picture is mixed: the day’s trade was lighter than average, but the broader accumulation trend has not turned down.
Key Levels & Scenarios
The immediate battleground is clear. 32.27 is the nearest resistance, and the upper Bollinger band at 32.36 sits just above it. If OCBC can move through that zone with stronger participation, the chart would start to look less stretched and more like a squeeze release. The next technical reference after that is the 3-month high at 32.57.
On the downside, 31.00 is the key support to watch. A move back toward that level would test whether the recent uptrend is being sustained by real demand or simply drifting on momentum. Because price is already near the top of the range, a failure to hold above support would quickly shift the balance toward consolidation.
Technical Verdict: HOLD (wait & see)
The chart still shows an uptrend, but the latest signals are not fully aligned. Price remains above the SMA20 and SMA50, which supports the broader structure. Bollinger Band compression suggests a breakout is possible, but Stochastic is overbought and MACD is slightly negative, which argues for caution near resistance. Volume is below average, so the latest push has not yet been confirmed by broad participation.
- Ideal Entry Range: 31.66 to 31.00, where the SMA20 and support cluster may offer a better risk framework.
- Exit Target: 32.27 to 32.57, aligning with resistance and the 3-month high.
- Stop Loss protection: below 31.00, since a break there would weaken the current range structure.
- Verdict invalidated if price breaks below 31.00.
For non-traders, this means the stock still looks healthy, but it is close enough to resistance that waiting for clearer confirmation is the cleaner technical read.
The next market cue will be whether OCBC can close decisively beyond 32.27 and 32.36, or whether the squeeze resolves first into a pullback toward 31.00.
Summary Data OCBC
| Last price | 32.22 SGD |
| Change 1 day / 5 days / 1 month | 0.66% / 1.74% / 2.22% |
| Trend / MA-cross | uptrend / none |
| SMA20 / SMA50 | 31.66 / 30.76 |
| RSI (14) / Stochastic %K | 61.5 / 90.5 |
| Bollinger %B / ATR | 90% / 0.48 |
| Support / Resistance 20 days | 31.00 / 32.27 |
| Data as of | 28 September 2026 08:00 WIB |



