Coca-Cola (KO) Stock Falls 0.71%: Up 5.8% in a Month
Technical analysis of KO stock on November 18, 2026: price 98.09 USD, trend uptrend, RSI 65.0, support 91.18, resistance 99.48.
By matthew jonathan
November 19, 2026·6 min read
Logo Coca-Cola — JournalArta illustration
Why KO is in focus today
Selected automatically from 11 NYSE (US) stocks by a technical-signal score with daily weighted randomisation — not a recommendation.
The pullback matters less than where it happened: the price remains above both its 20-day and 50-day moving averages, and the 20-day average itself rose 1.46% over the past five sessions. That combination tells a simple story. Buyers are still in control, but they are no longer paying up with conviction.
What makes this session worth dissecting is the tension in the signals. The structure is bullish, but the momentum is cooling. The stock is a textbook case of a trend that is intact while its engine is downshifting.
Advertisement
Trend and Price Action
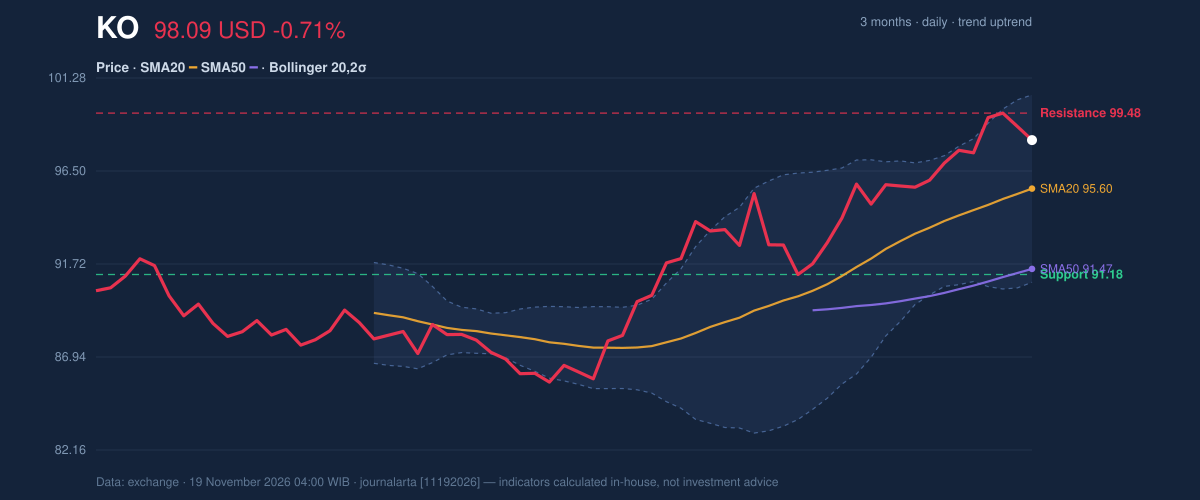
The architecture of the trend is clean. The 20-day simple moving average sits at $95.60, the 50-day at $91.47, and the price holds above both, with the shorter average above the longer one. That is the classic stack of a rising trend, and no new moving-average cross has formed — this is a trend that has been building, not a fresh signal flashing today. The 20-day average’s 1.46% rise over five days confirms the floor under the price is climbing, which is the quiet mechanic behind most durable uptrends.
Position within the range reinforces it. The stock trades at 83% of its 20-session range between support at $91.18 and resistance at $99.48. Range position near the top usually means buyers are defending territory, though it also means the easy money has been made. The three-month high of $100.56 and the upper Bollinger band at $100.42 cluster into a single ceiling. A close above that zone would signal a genuine breakout; a rejection there would confirm the market is content to consolidate.
3-month price action chart of KO: price, SMA20/50, Bollinger, support & resistance.
Advertisement
Wednesday’s 0.71% decline is best read as a retest, not a reversal. The stock pulled back toward the middle of its recent range while the moving averages continued their slow climb. The trend is intact; the price is simply resting on it.
Oscillators and Momentum
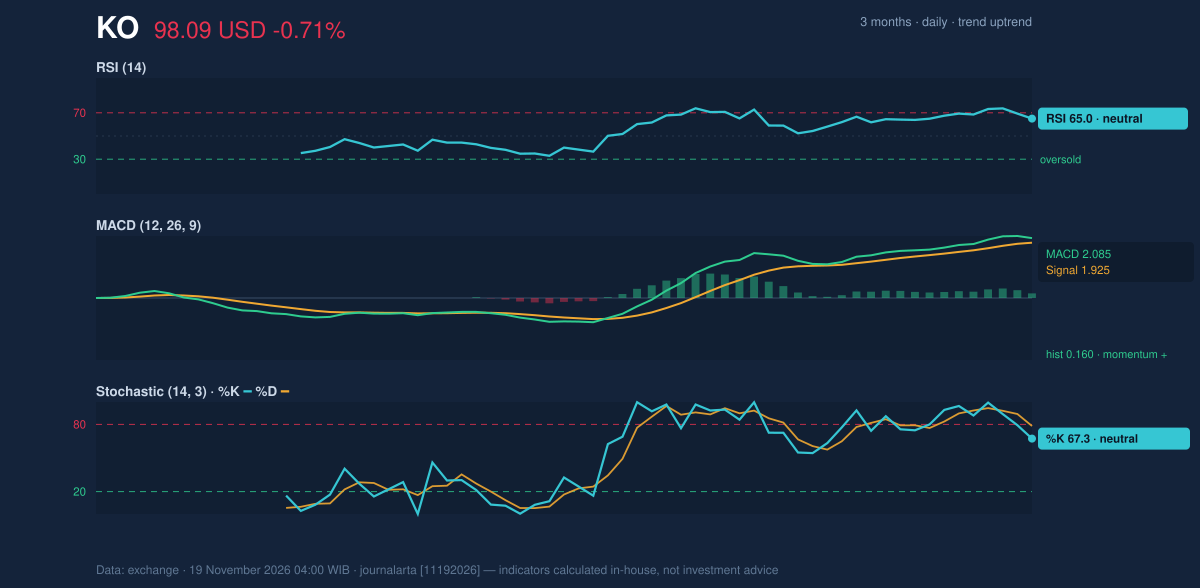
Here the picture gets more nuanced. The RSI(14) at 65.0 sits in neutral territory but, crucially, has rolled over from above 65 — a warning that upward pressure is easing even before the indicator reaches overbought levels. The stochastic is more blunt: %K at 67.3 is below %D at 78.6, a bearish crossover that points to short-term momentum turning down. The MACD offers the counterweight: at 2.085 versus a signal line of 1.925, its histogram of 0.160 shows positive momentum remains in place.
Read together, these three indicators are not contradicting each other so much as describing different timeframes. The MACD is a medium-term gauge and it says the trend is still working. The stochastic and the RSI turning over are short-term gauges saying the pace of the advance has slowed. Divergence of this type is common in healthy trends — and it is also exactly what appears before a deeper consolidation.
Momentum chart of KO: RSI(14), MACD, Stochastic.
Advertisement
The key test is whether the RSI holds above the 50 line. A drift lower into the 50s would be a routine cooling; a break below 50 would mark the first real crack in the momentum story.
Volatility and Volume
Volatility is moderate, not threatening. The ATR of 1.81 equals 1.8% of the share price, meaning an average session moves the stock less than $2. The Bollinger bands are 10.1% wide — described as normal — with the price at 76% of the band width (%B). That places the stock in the upper portion of its volatility envelope without hugging the top, leaving room for either a push toward $100.42 or a retreat toward the $95.60 middle band.
The volume is where the caution flag sits. Wednesday’s 16.5 million shares came in at 0.9× the 20-day average of 18.6 million — thin participation for a down day. More telling, on-balance volume is falling even as the price grinds higher. That is a divergence worth respecting: it suggests recent gains are being made on lighter buying interest rather than broad accumulation. A rising price on weakening volume is a trend running on fumes, not fuel.
Advertisement
Key Levels and Scenarios
The levels are tightly defined. On the upside, $99.48 is the near-term resistance, backed by the three-month high of $100.56 and the upper Bollinger band at $100.42. A decisive close above that cluster would validate the breakout thesis and open the path implied by the trend’s slope. On the downside, $95.60 is the 20-day average and first line of defense, with the 20-day support at $91.18 and the 50-day average at $91.47 forming a second, sturdier shelf just below.
If the price breaks $99.48, the resistance-to-support flip would give the bulls a platform. If it fails to hold $95.60, the pullback deepens toward the low-$90s, and the bearish RSI rollover gains credibility.
Advertisement
Fundamental Context
The technical case sits on a solid operating base. According to its SEC filing, Coca-Cola reported quarterly revenue of $13.38 billion for the quarter ended October 2, 2026, up 7.4% from $12.46 billion a year earlier. Net income rose to $4.01 billion from $3.70 billion, with diluted earnings per share of $0.93. That is top-line growth paired with margin expansion — the kind of quarter that supports a premium multiple and, for chart watchers, justifies the market’s willingness to hold the stock near its highs.
Technical Verdict: BUY
The verdict is BUY, driven by three technical pillars. First, the price structure is bullish: the stock trades above its 50-day average and the 20-day average sits above the 50-day, confirming an uptrend. Second, the MACD remains positive at 2.085 with a histogram of 0.160, so medium-term momentum has not broken. Third, the pullback to the 20-day average within that uptrend is a textbook continuation setup rather than a breakdown. The verdict is invalidated if the price falls below the $95.02 stop level, which would break the structure the thesis rests on.
- Entry Range: $96.74 – $98.09
- Exit Target 1: $102.69
- Exit Target 2: $107.30
- Stop Loss: $95.02
- Reward/Risk: 1.5 to 3.0
- Valid Until: December 17, 2026
In plain English: the trend is still pointing up, the recent dip looks like a rest rather than a reversal, but the softening RSI and falling on-balance volume mean the trade needs the stop loss to do its job.
The next scheduled test is the trading sessions into mid-December, when the validity window on these levels expires.
Disclaimer: This technical analysis is generated automatically from exchange data and indicators calculated by JournalArta, for information and education only. The verdict and the entry, target and stop-loss levels are not investment advice or a solicitation to buy or sell any security. Investment decisions and their risks rest solely with the reader.

 Take the quizWhat Kind of Holiday Spender Are You? Take the Black Friday QuizStart →




 Lifestyle · Food & HealthWhat Is Raynaud’s Syndrome? Why Fingers Turn White in the Cold
 Lifestyle · Food & Health4 Ways Walking After Meals Helps Your Body, Doctors Say
 Lifestyle · Food & Health4 Reasons to Eat Oatmeal, According to Nutrition Experts
 Lifestyle7 Signs Your Social Battery Is Running Low (and Why You Keep Cancelling Plans)