Legal & General Stock Week Ahead: Levels and Scenarios for November 23–27
Legal & General stock week ahead for November 23–27: last close 291.80 GBp, weekly change -7.28%, support 291.80, resistance 314.70.
By matthew jonathan
WIB·5 min read
Logo Legal & General Group — JournalArta illustration
The week of November 23 opens with Legal & General Group shares at 291.80 GBp on the London Stock Exchange, after five straight declines wiped 7.28% off the stock in the session run to November 20 and left it sitting exactly on its 20-day support line. It is an uncomfortable position for a stock that had been drifting sideways: the close is below both the 20-day and the 50-day average, and the only bullish count in the data is zero.
Last Week in Review
Every session went the same way. Volume tells the story more clearly than price: average daily turnover was 27,426,434 shares against a 20-session average of 15,760,602, a 1.74x multiple. Supply met demand and supply won. The monthly picture is milder at -2.41%, which says the damage is concentrated in this one week rather than a slow erosion.
Advertisement
Technical Map for the Week Ahead
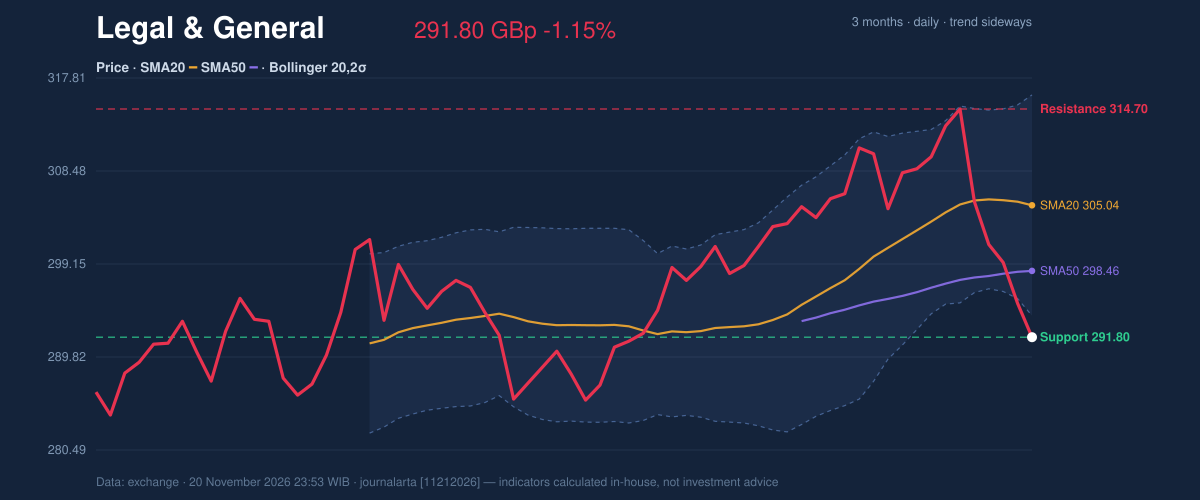
The central fact is that price has arrived at 291.80 GBp, the 20-day support, having closed the reference range at 0% of it. A break below that level opens the three-month low at 282.78 GBp, with the price minus 1.5x ATR level of 283.71 GBp sitting just above it as a practical buffer. Above, the road back runs through the 20-day resistance at 314.70 GBp and the three-month high at 316.80 GBp; the price plus 1.5x ATR level of 299.89 GBp is the first intermediate marker.
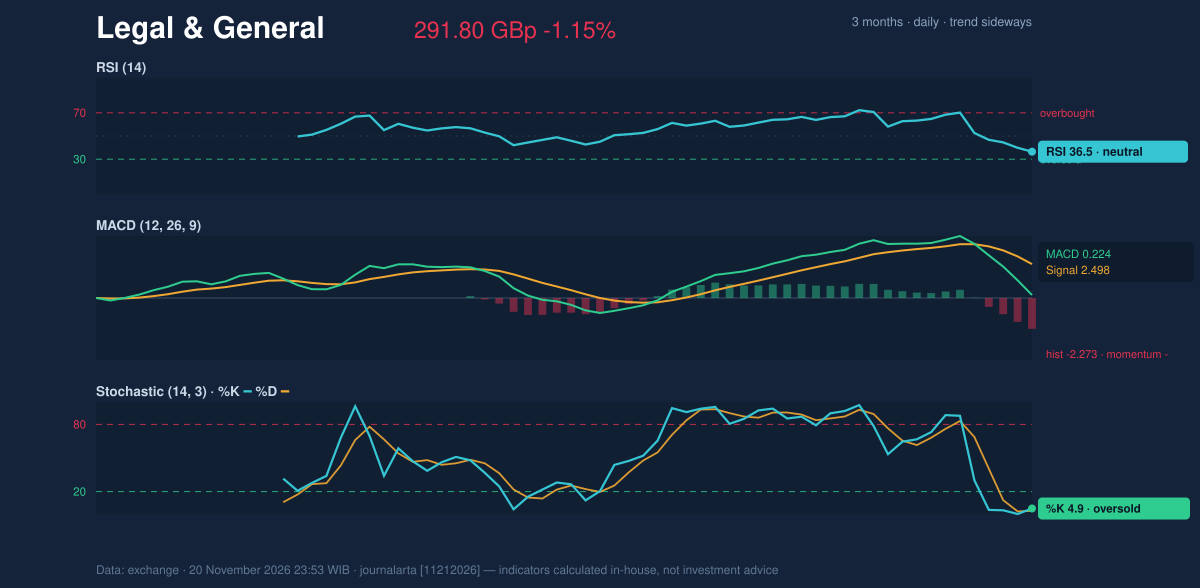
Momentum is not helping. RSI(14) reads 36.5 — in the neutral 30 to 50 band, but the computed signal flags it as rolling over from above 65. Stochastic is deeply oversold at %K 4.9 / %D 2.8, which argues for a bounce rather than a trend change. MACD tells the harder story: the line at 0.224 sits below its signal at 2.498, histogram -2.273, squarely negative.
3-month price action chart of Legal & General: price, SMA20/50, Bollinger, support & resistance.
Advertisement
The Bollinger picture is the most interesting thing on the chart. The bands span 316.11 on top, 305.04 in the middle and 293.96 below, with band width narrowing to 7.3% — a squeeze. The computed signals record that squeeze as resolved with a close below the lower band, %B at -10%, and the 20-day average sitting above the 50-day at 305.04 versus 298.46 while the average's slope is a barely perceptible -0.03%/5 days. ATR(14) is 5.39, or 1.8% of price, so volatility is moderate rather than panicked. OBV is falling, which fits the heavy-volume decline.
Momentum chart of Legal & General: RSI(14), MACD, Stochastic.
Bullish scenario: a close back above 314.70 GBp would reclaim the 20-day resistance and put the three-month high of 316.80 GBp in play, with the lower band at 293.96 left behind as a failed breakdown. Bearish scenario: a close below 291.80 GBp would confirm the lower-band break and target 282.78 GBp, the three-month low, with 283.71 GBp as the ATR-derived waypoint. Two bearish signals and no bullish ones sit on the tally.
Advertisement
Fundamentals and Catalysts
The company's own disclosure on November 16 gave the week its starting contradiction: Legal & General's Solvency II coverage ratio rose to 213% at September 30, 2026, from 201% at the end of June and 203% at the end of 2025. A stronger capital position is the kind of fact that normally supports a life insurer's valuation, and it is worth flagging that the week's selling began on the same day it was published.
The analyst side moved the other way. On November 18, RBC Capital Markets cut its 2026-2028 pension risk transfer volume view for the company by about £1 billion and kept an underperform rating — a signal on the sector's growth engine rather than on solvency, published two days into the selloff and followed by three more down sessions.
Advertisement
Macro, Political and Global Factors
The research available for this week contains no dated macro, political or global facts tied to the stock, so nothing on rates, regulation or overseas markets can be attributed without speculation. The week ahead is therefore a technical and sector-driven one, with the pension risk transfer revision as the only fresh external input on record.
Risks and What Would Invalidate the Scenario
The bearish case is invalidated by a close above 314.70 GBp, which would neutralise the lower-band break and shift attention to 316.80 GBp. The bullish recovery case is invalidated by a close below 291.80 GBp, with 282.78 GBp as the next reference. On the fundamental side, the risk is a wider reassessment of pension risk transfer volumes following RBC's reduction of about £1 billion for 2026-2028 — a sector-level concern that can outlast a single week. Against that sits the capital buffer disclosed on November 16, whose 213% ratio is the strongest counterweight on the tape. Volume above the 20-day average is a further risk: heavy selling into a support test raises the chance of a decisive break rather than a bounce.
Advertisement
Technical Verdict for the Week: HOLD (wait & see)
The code-generated verdict is HOLD (wait & see), with a score of -36 on the -100 to +100 scale, well short of the -60 sell threshold. Trend and momentum are simply not aligned.
- Price sits below both the 20-day average at 305.04 and the 50-day at 298.46, and RSI at 36.5 has rolled over from above 65 — the trend is not supportive.
- The Bollinger squeeze has resolved with a close below the lower band at 293.96 and %B at -10%, while the 20-day average remains above the 50-day — conflicting signals.
- Stochastic at %K 4.9 / %D 2.8 is oversold, and the Solvency II ratio of 213% disclosed on November 16 gives a fundamental reason not to treat this as a one-way breakdown.
Verdict invalidated if price closes below 291.80 GBp.
- Entry Range (upside scenario): a close above 314.70 GBp
- Target Price (upside): 316.80 GBp
- Stop Loss (upside): 293.96 GBp (lower Bollinger band)
- Entry Range (downside scenario): a close below 291.80 GBp
- Target Price (downside): 282.78 GBp
- Stop Loss (downside): 299.89 GBp (price + 1.5x ATR)
Translated for a non-trader: the stock is pinned on a support line with momentum pointing down but oversold readings pointing back up, so the sensible stance is to wait for the market to show which side breaks first.
Disclaimer: This technical analysis is generated automatically from exchange data and indicators calculated by JournalArta, for information and education only. The verdict and the entry, target and stop-loss levels are not investment advice or a solicitation to buy or sell any security. Investment decisions and their risks rest solely with the reader.

 Take the quizWhat Kind of Holiday Spender Are You? Take the Black Friday QuizStart →





 Markets · FintechHow to Calculate Compound Interest: Formula, Examples and the Rule of 72
 Lifestyle · Food & HealthNormal Blood Pressure Chart by Age: Healthy Ranges Explained
 Lifestyle · Food & HealthWhat Is Raynaud’s Syndrome? Why Fingers Turn White in the Cold
 Lifestyle · Food & Health4 Ways Walking After Meals Helps Your Body, Doctors Say