Lloyds Stock Week Ahead: Levels and Scenarios for November 23–27
Lloyds stock week ahead for November 23–27: last close 94.74 GBp, weekly change -3.91%, support 93.50, resistance 103.90.
Last Week in Review
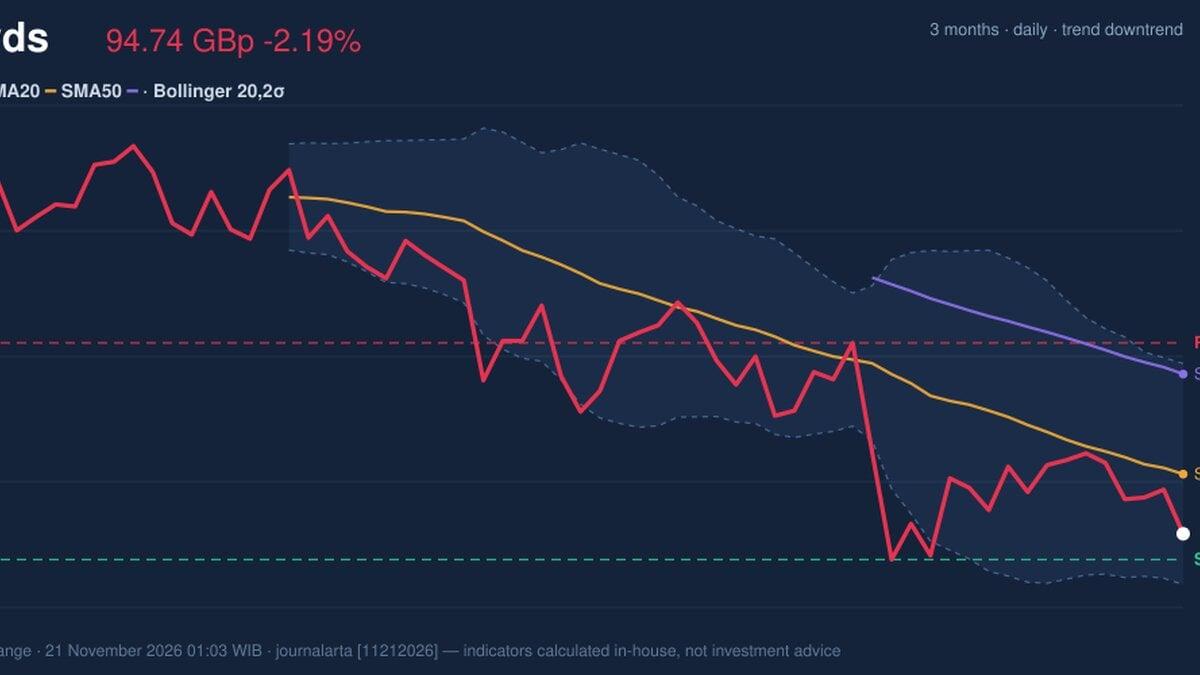
Lloyds Banking Group closed the week of November 16–20 at 94.74 GBp, down 3.91% from 98.60 GBp a week earlier — a slide that erased the prior week's opening gap of 98.58 and left the stock pinned near the bottom of its range. The week's high of 99.08 GBp came on Monday November 16; the low of 94.64 GBp landed on Friday November 20, the same session that delivered the worst single-day move at -2.19%. The rebound was thin: Thursday November 19 was the only meaningful up session at 0.39%, and two rising sessions against three falling ones tell the story of a market that sold into strength.
Volume confirms the lack of conviction. Daily turnover averaged 146,228,542 shares against a 20-session norm of 168,740,346 — a ratio of 0.87x. Monday's gap higher was not chased, and Friday's break lower came on the week's heaviest tape at 155,031,564 shares, still below the 20-day average of 171,605,346. Closing at just 2% of the week's range, with a full 4.69% spread between high and low, is a technician's way of saying the sellers controlled the close. The one-month number is equally blunt: -5.87%.
Technical Map for the Week Ahead
The structural picture is a downtrend under repair that has not yet repaired. Lloyds trades below both its 20-day and 50-day averages — SMA20 at 97.60 GBp and SMA50 at 102.41 GBp — and the 20-day average is itself drifting lower at a slope of -1.35% over five sessions, the mechanical definition of a falling trend. The Bollinger band setup (20, 2σ) runs from 92.30 GBp at the lower rail to 102.91 GBp at the upper, with the middle at 97.60; the band width of 10.9% is normal, meaning volatility is not stretched enough to suggest a violent snapback. Percent-B at 23% puts the price in the lower quarter of the envelope.
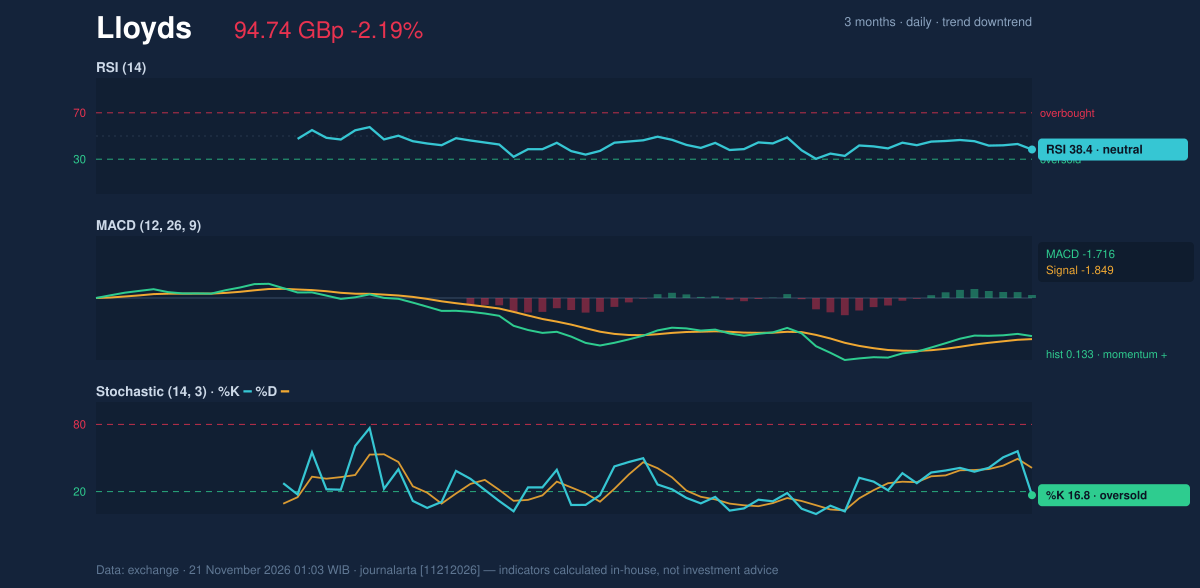
Momentum is the one place the bears have not fully won. MACD sits at -1.716 against a signal line of -1.849, leaving a histogram of +0.133 — a positive reading, meaning the negative momentum is decelerating even as the absolute level stays under water. RSI(14) at 38.4 is neutral in label but weak in direction, and the Stochastic pair (%K 16.8, %D 41.2) is oversold, a condition that often precedes a bounce but says nothing about its size. OBV is rising, a quiet divergence that suggests distribution has slowed.
On the support and resistance grid: the 20-day support sits at 93.50 GBp and the 20-day resistance far overhead at 103.90 GBp — the stock is at roughly 12% of that range. Average true range of 2.30 GBp, or 2.4% of the price, marks moderate volatility — roughly two pounds of daily breathing room.
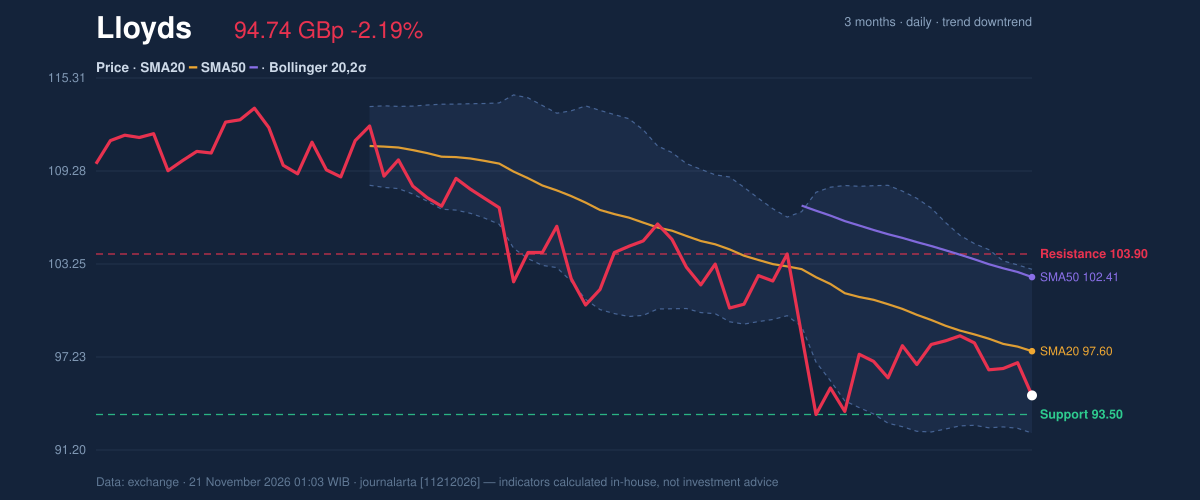
A bullish scenario needs the stock to hold 93.50 and reclaim the 97.60 middle band; if it breaks above 97.60 GBp and closes there, the path toward the 102.41 50-day average opens. A bearish scenario is shorter and more immediate: if it slips below 93.50 GBp, the next structural reference is the 93.00 three-month low, and a break of that floor would confirm the weekly downtrend rather than merely extend it. Watch the MACD histogram — a flip back negative would remove the one supportive limb.
Fundamentals and Catalysts
The regulatory backdrop for Lloyds' core UK consumer lending was re-open for inspection last week. The Financial Conduct Authority published Evaluation Paper 26/1 on November 18, assessing the credit card persistent-debt remedies that came in during 2018 and finding total compliance costs of around £281.6 million. For a bank whose franchise is built on credit cards, mortgages and retail deposits, any review of persistent-debt treatment is material to how much forbearance and remediation it must price in — the paper does not itself change rules, but a compliance cost of that size is the kind of number that feeds into conduct-risk provisioning and the sector's cost debate.
Separately, the FCA's wholesale banking supervisory report, Insights 3, published on November 2 but circulating in the market on November 16, said the regulator sees lenders providing funding and other services to businesses engaged in Annex 1 activities without sufficient due diligence. That is a supervision signal rather than a fine, but for a group with a ring-fenced retail arm and a commercial banking division, it flags where the compliance microscope is pointed.
Macro, Political and Global Factors
UK inflation went the wrong way for anyone hoping for early rate relief. Consumer prices rose 3.6% in the twelve months to October 2026, up from 3.5% the month before, according to data published on November 18. For a domestically-focused lender like Lloyds, a stickier print keeps the Bank of England's policy path uncertain: higher-for-longer rates support net interest margins but squeeze borrowers and can raise credit losses — the two sides of the same ledger that investors are currently weighting toward the second.
The pound added its own pressure. A weaker currency is a general UK risk-asset headwind at the index level and tends to accompany foreign selling of domestic financials. Policy was also active: HM Treasury published the independent Access to Banking Services Review report on November 18, and the Government accepted the central recommendation to legislate protection for face-to-face banking. For a branch-heavy incumbent, mandated physical access is a cost-line consideration — supportive of franchise value, less so for the cost-income story.
Risks and What Would Invalidate the Scenario
The technical risk to the downside call is a mean-reversion bounce. RSI at 38.4 and the Stochastic at 16.8 are stretched, OBV is rising, and the MACD histogram is positive at +0.133 — the ingredients of a rally into the 97.60 SMA20 that would not break the downtrend but would pressure anyone positioned short. That is why a close above 98.66 GBp — the level computed as the stop above the sell zone — would mark the scenario as failed. Equally, a decisive break above 97.60 followed by the 102.41 SMA50 would be a genuine trend change, not noise.
On the fundamental side, the inflation print and the FCA's persistent-debt evaluation keep conduct and credit costs on the table; a weaker pound raises the cost of any foreign-currency funding or hedging the group runs. The announced legislative plan on banking access is a live policy risk to the cost base, while the ongoing supervisory focus on Annex 1 due diligence could tighten compliance spending across the sector. None of these is a forecast — they are the variables that decide how much of the weekly -3.91% is reversal and how much is repricing.
Technical Verdict for the Week: SELL
The verdict is SELL, computed at a score of -68 on a −100 to +100 scale. Three reasons carry it: the price sits below its 50-day average at 102.41 GBp and below the 20-day at 97.60, the 20-day average is itself falling at -1.35% over five sessions, and RSI at 38.4 leaves room to fall further before the oversold zone at 30 is reached — the 30–50 band is where a downtrend typically consolidates before its next leg. The single bullish technical signal, a bounce into the 20-day average within a downtrend, ranks 0 against 1 bearish signal in the computed tally; it is not absent, it is simply outgunned.
- Entry Range (sell zone): 94.74 – 96.46 GBp
- Target 1: 88.86 GBp
- Target 2: 82.98 GBp
- Stop Loss: 98.66 GBp
The setup carries a reward/risk of 1.5 to 3.0 and is valid until December 19, 2026. It is invalidated if the price breaks above 98.66 GBp on a closing basis.
In plain English: the chart says Lloyds is still falling, and the bank's own strong signals point to further weakness rather than a floor — though a bounce back to the 97–98 area is the risk any seller has to respect. This is technical analysis, not an investment recommendation.
Lloyds Week Ahead Data
| Trading week | November 16 – November 20 (5 sessions) |
| Weekly change | -3.91% (98.60 → 94.74 GBp) |
| Week high / low | 99.08 (November 16) / 94.64 (November 20) |
| Best / worst session | 0.39% (November 19) / -2.19% (November 20) |
| Avg daily volume vs prior 20 sessions | 146,228,542 vs 168,740,346 (0.87x) |
| SMA20 / SMA50 | 97.60 / 102.41 |
| RSI (14) / Stochastic %K | 38.4 / 16.8 |
| Support / Resistance 20 days | 93.50 / 103.90 |
| 3-month high / low | 123.10 / 93.00 |
| Week covered | November 23–27, 2026 |
| Data as of | 21 November 2026 01:03 WIB |
| JournalArta research verdict (score) | Sell (-68) |
| Sell zone | 94.74 – 96.46 |
| Target 1 / 2 | 88.86 / 82.98 |
| Stop loss | 98.66 |
| Reward/risk | 1.5 / 3.0 |
Today's full Buy and Sell list for UK, Singapore & Hong Kong stocks →
Disclaimer: This technical analysis is generated automatically from exchange data and indicators calculated by JournalArta, for information and education only. The verdict and the entry, target and stop-loss levels are not investment advice or a solicitation to buy or sell any security. Investment decisions and their risks rest solely with the reader.
Track Lloyds share price daily: live levels, support/resistance and our full Lloyds analysis history.
 Take the quizWhat Kind of Holiday Spender Are You? Take the Black Friday QuizStart →
- 1Stock Market Today: Dow Slides 1.34% and VIX Jumps 15% at Midday

- 2Joachim Klement to Sell Stocks After S&P 500 Signal

- 3Stock Market Today: Nasdaq, S&P 500 Futures Slide as AI Selloff Deepens

- 4Kenneth Walker’s Groin Injury Puts Cardinals Game in Doubt

- 5Pat Cummins Faces Captaincy Doubts From Mitchell Johnson

 Markets · FintechHow to Calculate Compound Interest: Formula, Examples and the Rule of 72
 Lifestyle · Food & HealthNormal Blood Pressure Chart by Age: Healthy Ranges Explained
 Lifestyle · Food & HealthWhat Is Raynaud’s Syndrome? Why Fingers Turn White in the Cold
 Lifestyle · Food & Health4 Ways Walking After Meals Helps Your Body, Doctors Say