UNH Stock Week Ahead: Technical Outlook for November 23–27
UNH stock week ahead for November 23–27: last close 339.85 USD, weekly change -16.59%, support 330.48, resistance 412.02.
By Elena Vance
WIB·6 min read
Logo UnitedHealth Group — JournalArta illustration
UnitedHealth Group enters the holiday-shortened week of November 23–27 as one of the most violent large-cap moves on the NYSE board, and international readers should read the numbers before the narrative. The stock closed at 339.85 USD on November 20, down 16.59% for the week and 18.71% over one month. That is a repricing, not a drift.
Last Week in Review
Friday brought relief, not recovery. The session of November 20 gained 2.84%, the week's best, after the November 19 low of 324.67 — a level that also marks the three-month floor. The close sits at just 17% of that range, near the bottom.
The worst session was November 18, down 10.21% in a single day — the kind of gap that usually follows a policy or disclosure shock rather than ordinary repositioning. Two sessions closed higher, three lower.
Volume is the tell. Average daily volume for the week reached 12,494,340 shares against a 20-session prior average of 4,927,670 — 2.54x normal. Friday alone traded 12,777,300 shares, 1.9x the 20-day average, and the session closed in the green. Heavy volume on an up day after a collapse is often read as capitulation followed by absorption, but it is not confirmation.
Advertisement
Technical Map for the Week Ahead
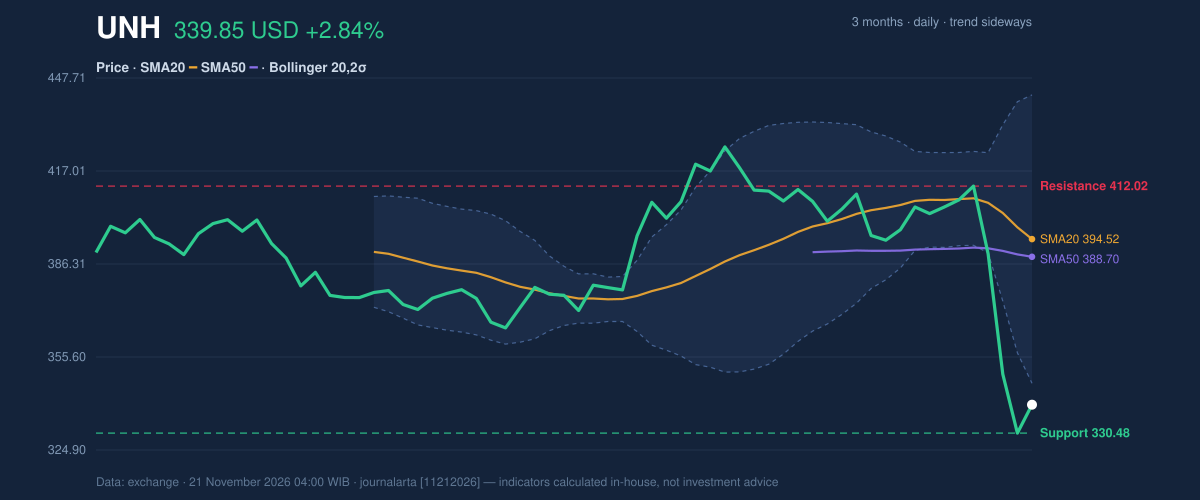
The structure is broken. The close at 339.85 sits below the 20-day moving average of 394.52 and below the 50-day average of 388.70; the 20-day itself is sloping down at -3.24% over five days. No new moving-average cross has formed — the damage is faster than the averages can register.
Bollinger bands tell the same story in volatility terms. The lower band is 346.91, and the close is already beneath it, with %B at -7% and band width at 24.1%, described as widening into high volatility. The computed signal set records a bearish count of 1 against 0 bullish, driven by a squeeze that resolved with a close below the lower band. ATR(14) at 16.10, or 4.7% of price, sets the daily noise budget.
3-month price action chart of UNH: price, SMA20/50, Bollinger, support & resistance.
Advertisement
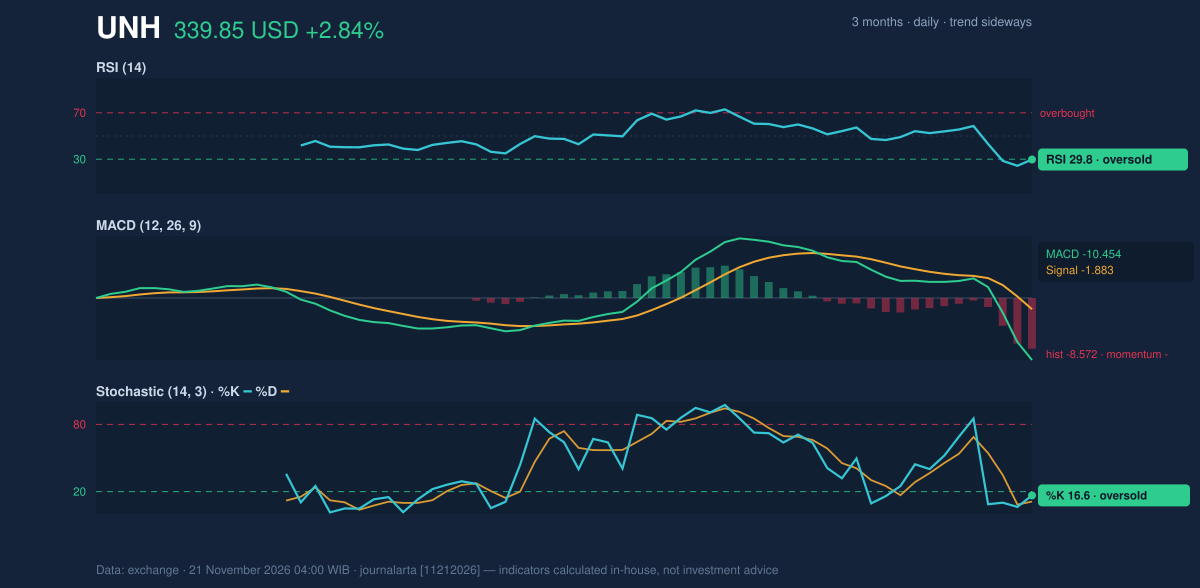
Momentum is deeply stretched. RSI(14) at 29.8 is in oversold territory, and Stochastic %K at 16.6 against %D at 11.0 is also oversold. MACD at -10.454 with a signal of -1.883 and a histogram of -8.572 still shows negative momentum. Oversold readings can persist in a downtrend; they are conditions, not triggers.
Momentum chart of UNH: RSI(14), MACD, Stochastic.
The bullish scenario needs a close above the 20-day resistance at 412.02, which would first require reclaiming the 20-day average at 394.52 and the 50-day at 388.70. If it breaks above 412.02, the three-month high of 426.55 becomes the visible reference. The bearish scenario activates on a break below the 20-day support at 330.48; if it slips below 330.48, the three-month low of 324.67 is the next reference, with the 1.5x-ATR level of 315.70 below that. Between the two pivots, the stock is in no-man's land: the close is at 11% of the 20-day range.
Advertisement
Fundamentals and Catalysts
The fundamental record is more mixed than the price action implies. Third-quarter 2026 revenue came in at $112.69 billion, down 0.4% from $113.16 billion a year earlier, according to the Form 10-Q filed on November 3. Net income for the same quarter was $4.11 billion versus $2.35 billion a year earlier, with diluted earnings per share of $4.56 — profitability improved sharply even as the top line slipped.
An earlier release on October 12 put third-quarter revenue at $112.7 billion against $113.2 billion and earnings from operations at $6.6 billion versus $4.3 billion in the year-ago quarter. The pattern is margin expansion on flat-to-lower revenue.
On the governance side, the company filed a Form 8-K with the SEC on November 9 reporting a change of directors or officers. Filings of this type do not state cause; they state fact.
The sector backdrop carries the heaviest weight. On November 17, the Centers for Medicare and Medicaid Services proposed the Comprehensive Regulations to Uncover Suspicious Healthcare rule, which would increase Medicare Advantage oversight and audit scrutiny. For a company whose insurance arm is a Medicare Advantage heavyweight, a compliance-cost and audit-frequency proposal is a direct earnings variable, and it lands in the same window as the week's steepest decline — a timing coincidence worth noting without asserting causation.
Advertisement
Macro, Political and Global Factors
Inflation is not fully subdued. The Consumer Price Index rose 0.4% month-on-month in October and core prices rose 0.3%, according to data reported on November 9. For insurers, input costs are medical claims rather than raw materials, but sticky core inflation keeps rate expectations anchored above zero and sustains pressure on valuations of long-duration cash flows.
The Federal Reserve held its policy rate in a 3.75%–4% range at the October 27–28 meeting, as reported on November 19. A pause removes the near-term easing argument but also removes the near-term tightening shock — neutral for direction, relevant to the discount rate underlying every defensive holding.
The political dimension is the live wire: the CMS proposal of November 17 is a policy event with a public comment lifecycle ahead, and proposed rules of this kind can be revised, finalized or withdrawn. That uncertainty itself is a factor the market prices before the text is settled.
Advertisement
Risks and What Would Invalidate the Scenario
A close above 412.02 would invalidate the bearish read by putting price back above the 20-day average and the 20-day resistance in sequence. A close below 330.48 would invalidate any stabilizing read, exposing 324.67 and then 315.70.
The momentum risk cuts both ways. MACD's histogram at -8.572 is still widening negative, and the Bollinger signal remains bearish with a close below the lower band — the two indicators that matter most here say the downtrend has not yet exhausted itself statistically, even with RSI at 29.8.
The structural risk is policy. The Medicare Advantage oversight proposal of November 17 creates headline risk through the comment period, and rule text that tightens audit standards can move the sector before any financial effect appears in earnings. On the company side, the November 9 officer or director change adds an unquantified governance variable. Finally, volume at 2.54x the prior average amplifies both directions: liquidity is present, which means gaps can travel.
Advertisement
Technical Verdict for the Week: HOLD (wait & see)
HOLD (wait & see). The computed research verdict is HOLD, with a score of -13 on a −100 to +100 scale, well inside the neutral band between the +60 buy and −60 sell thresholds.
- Price sits below its 50-day average of 388.70, while the 20-day average at 394.52 remains above the 50-day — trend and momentum are not aligned.
- The five-day drop of 16.59% with 0 bullish versus 1 bearish computed signal argues against chasing either direction before a pivot is tested.
- Friday's volume at 1.9x average on an up day, alongside RSI at 29.8, suggests the selling is stretched, but MACD at -10.454 shows no reversal yet.
Conditional scenarios from the reference levels: the upside case requires a close above the 20-day resistance at 412.02, opening the three-month high of 426.55; the downside case activates below 20-day support at 330.48, exposing the three-month low of 324.67 and the 1.5x-ATR level of 315.70.
Verdict invalidated if price breaks above 412.02 or below 330.48 on a closing basis.
In plain English: the chart is oversold but the trend is still down, so the honest technical stance is to wait for the stock to choose a side of its 330.48–412.02 channel rather than act inside it.
*This is technical analysis, not an investment recommendation; the site disclaimer applies.*
Disclaimer: This technical analysis is generated automatically from exchange data and indicators calculated by JournalArta, for information and education only. The verdict and the entry, target and stop-loss levels are not investment advice or a solicitation to buy or sell any security. Investment decisions and their risks rest solely with the reader.

 Take the quizWhat Kind of Holiday Spender Are You? Take the Black Friday QuizStart →




 Markets · FintechHow to Calculate Compound Interest: Formula, Examples and the Rule of 72
 Lifestyle · Food & HealthNormal Blood Pressure Chart by Age: Healthy Ranges Explained
 Lifestyle · Food & HealthWhat Is Raynaud’s Syndrome? Why Fingers Turn White in the Cold
 Lifestyle · Food & Health4 Ways Walking After Meals Helps Your Body, Doctors Say