Vodafone Stock Week Ahead (November 23–27): What Comes After a 7.35% Weekly Loss
Vodafone stock week ahead for November 23–27: last close 108.35 GBp, weekly change -7.35%, support 108.35, resistance 121.15.
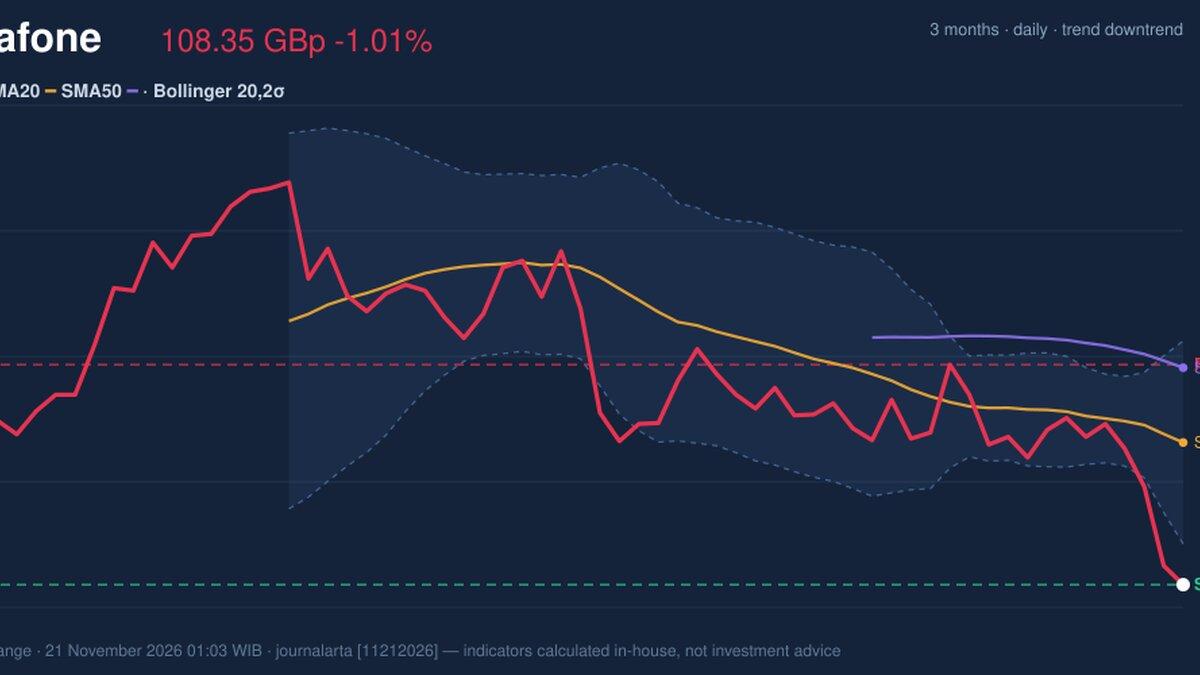
Last Week in Review
Vodafone Group shares closed Friday on the London Stock Exchange at 108.35p, down -7.35% over the week of November 16–20, after the stock opened the first session at 116.95p and never regained that level. The five-day move matches both the five-day and weekly change, extending a one-month decline of -8.33%.
The week was lopsided. Only one session finished higher — Monday November 16, up 0.64%, which also printed the weekly high of 119.25p. Four sessions fell, with the worst on Thursday November 19 at -4.03%. Friday's close of 108.35p sat just above the weekly low of 108.00p and within 3% of the week's 10.42% range — a weak finish after a wide swing. Average daily volume was 47,569,053 shares, 0.79x the prior 20-session average of 59,922,937, so the selloff came on thinner-than-usual turnover rather than a heavy capitulation.
Technical Map for the Week Ahead
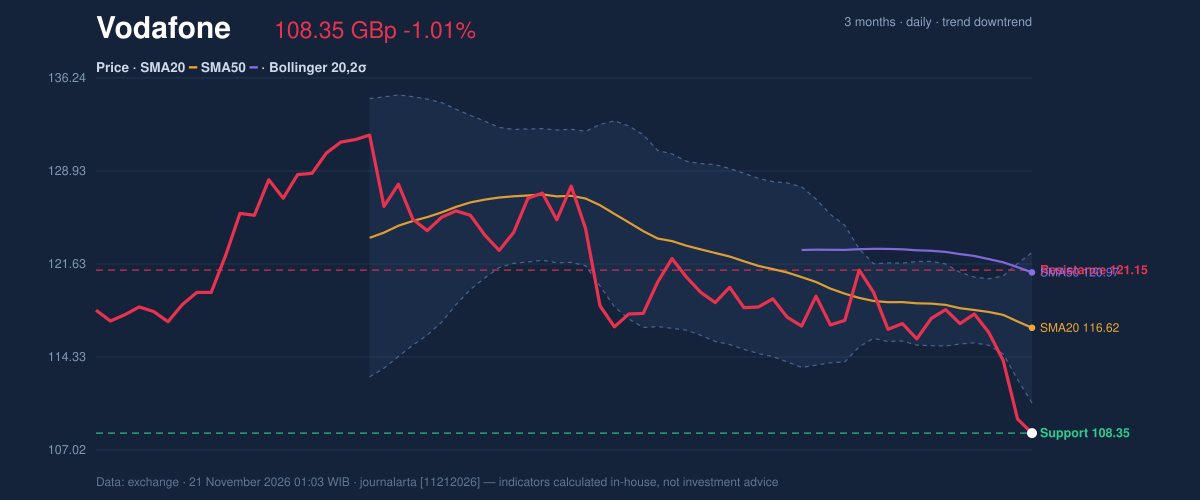
The chart setup leans negative going in. The price sits below both the 20-day simple moving average at 116.62 and the 50-day SMA at 120.97, and the 20-day average is itself below the 50-day, with a slope of -1.30% over five days — the classic structure of a downtrend. The 20-day support is 108.35 (right at the close), while 20-day resistance sits at 121.15. The three-month range is 132.07 at the top and 108.00 at the bottom, so the stock is pressing against the lower edge of its recent band.
Momentum is stretched. RSI(14) reads 30.1, on the neutral/oversold line, while Stochastic %K 2.4 and %D 3.1 are deeply oversold. MACD is negative at -2.293 against a signal of -1.551, with a histogram of -0.742 — momentum still deteriorating. Bollinger bands run from 122.53 (upper) to 110.71 (lower) around a 116.62 mean; %B is -20%, meaning the close has slipped below the lower band, and band width is a normal 10.1%. ATR(14) of 3.05 is about 2.8% of the price — moderate volatility. On-balance volume is falling, and the last session traded 0.9x normal volume.
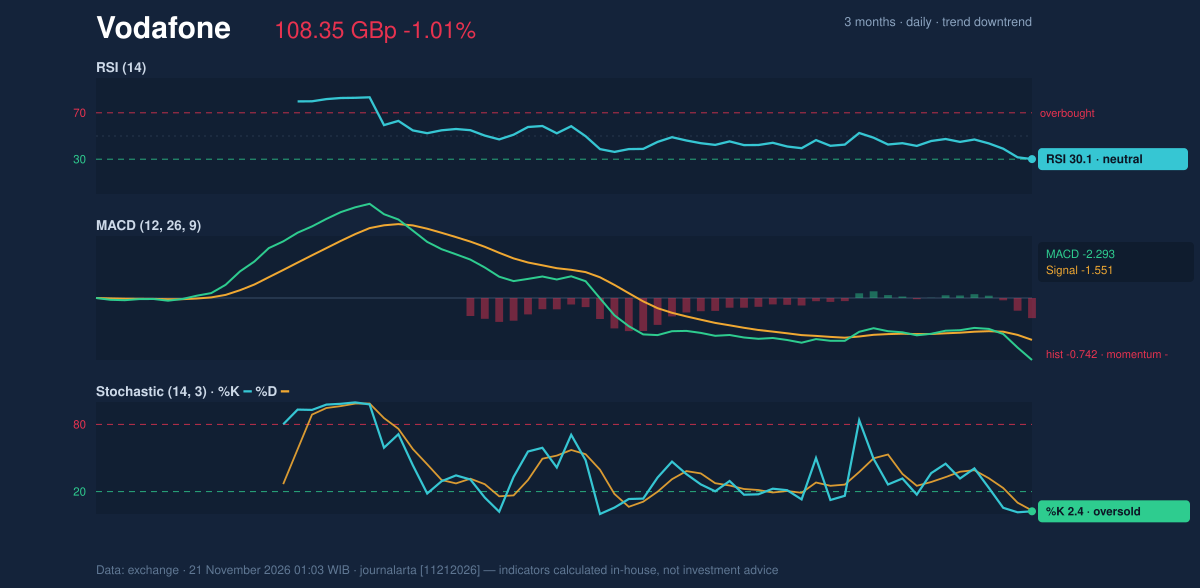
The bullish scenario needs a reclaim: if price breaks back above the 20-day resistance at 121.15, it would put the stock through the Bollinger midpoint and begin to repair the trend. The bearish scenario is the live one: if it slips below the support at 108.35, the path toward the three-month low of 108.00 opens, and a decisive break there confirms the lower-band close.
Fundamentals and Catalysts
The operating picture and the share chart are diverging. In research published on November 20, Vodafone shares were noted to have experienced a sharp pullback recently, while the company is "actually performing pretty well at the moment" on business performance. That gap between fundamental delivery and share-price action is the core tension for holders. The same November 20 materials describe Vodafone's footprint across Germany, the UK, rest of Europe, Turkey and South Africa, and note the company was incorporated in 1984 and is based in Newbury, UK. No scheduled company catalysts fall inside the November 23–27 window per the research set.
Macro, Political and Global Factors
Nothing in the research block specifies a dated macro, policy or global event for this week. The relevant context is the divergence flagged on November 20: a business performing well against a share price in pullback, a gap that typically reflects market sentiment rather than operating results. With no fresh policy trigger on the calendar, the week's direction is likely to be set by flows and the technical levels themselves rather than company-specific news.
Risks and What Would Invalidate the Scenario
The main risk to the bearish read is a snap-back. RSI at 30.1 and Stochastic at 2.4/%K are oversold, and a stock that closes below the Bollinger lower band (110.71, %B -20%) can rebound sharply on any buying. A reclaim of 121.15 — clearing the 20-day resistance and the 116.62 mean — would invalidate the downside scenario. Conversely, a close above the stop at 113.53 breaks the bearish setup outright, while a break below 108.00 hardens it. From the fundamentals side, the November 20 observation that business performance is strong is a risk to any purely technical bearish call — sentiment can turn quickly if operating delivery is recognised.
Technical Verdict for the Week: SELL
The case rests on three signals. First, the trend structure: price is below the 50-day average at 120.97, the 20-day average at 116.62 is below the 50-day, and the slope is negative — a confirmed downtrend. Second, momentum: MACD at -2.293 with a negative histogram of -0.742 shows selling pressure still building. Third, the Bollinger squeeze has resolved to the downside, with the close below the lower band at 110.71 (%B -20%) and falling on-balance volume confirming distribution. The verdict is invalidated if price breaks above the stop loss at 113.53.
- Entry Range: 108.35 – 110.63 (sell zone)
- Target Price 1: 100.58
- Target Price 2: 92.81
- Stop Loss: 113.53 (reward/risk 1.5 / 3.0; valid until 19 Dec 2026)
In plain terms: the chart points to more weakness before any recovery, with the first meaningful floor around 100.58p unless buyers push the stock back above 113.53p.
Vodafone Week Ahead Data
| Trading week | November 16 – November 20 (5 sessions) |
| Weekly change | -7.35% (116.95 → 108.35 GBp) |
| Week high / low | 119.25 (November 16) / 108.00 (November 20) |
| Best / worst session | 0.64% (November 16) / -4.03% (November 19) |
| Avg daily volume vs prior 20 sessions | 47,569,053 vs 59,922,937 (0.79x) |
| SMA20 / SMA50 | 116.62 / 120.97 |
| RSI (14) / Stochastic %K | 30.1 / 2.4 |
| Support / Resistance 20 days | 108.35 / 121.15 |
| 3-month high / low | 132.07 / 108.00 |
| Week covered | November 23–27, 2026 |
| Data as of | 21 November 2026 01:03 WIB |
| JournalArta research verdict (score) | Sell (-84) |
| Sell zone | 108.35 – 110.63 |
| Target 1 / 2 | 100.58 / 92.81 |
| Stop loss | 113.53 |
| Reward/risk | 1.5 / 3.0 |
Today's full Buy and Sell list for UK, Singapore & Hong Kong stocks →
Disclaimer: This technical analysis is generated automatically from exchange data and indicators calculated by JournalArta, for information and education only. The verdict and the entry, target and stop-loss levels are not investment advice or a solicitation to buy or sell any security. Investment decisions and their risks rest solely with the reader.
Track Vodafone share price daily: live levels, support/resistance and our full Vodafone analysis history.
 Take the quizWhat Kind of Holiday Spender Are You? Take the Black Friday QuizStart →
- 1Stock Market Today: Dow Slides 1.34% and VIX Jumps 15% at Midday

- 2Joachim Klement to Sell Stocks After S&P 500 Signal

- 3Stock Market Today: Nasdaq, S&P 500 Futures Slide as AI Selloff Deepens

- 4Kenneth Walker’s Groin Injury Puts Cardinals Game in Doubt

- 5Pat Cummins Faces Captaincy Doubts From Mitchell Johnson

 Markets · FintechHow to Calculate Compound Interest: Formula, Examples and the Rule of 72
 Lifestyle · Food & HealthNormal Blood Pressure Chart by Age: Healthy Ranges Explained
 Lifestyle · Food & HealthWhat Is Raynaud’s Syndrome? Why Fingers Turn White in the Cold
 Lifestyle · Food & Health4 Ways Walking After Meals Helps Your Body, Doctors Say