Procter & Gamble (PG) Stock Rises 0.21%: Up 7% in a Month
Technical analysis of PG stock on November 12, 2026: price 168.03 USD, trend uptrend, RSI 65.9, support 156.84, resistance 168.66.

Why PG is in focus today
- Trading near its 3-month high (170.52)
Selected automatically from 80 NYSE (US) stocks by a technical-signal score with daily weighted randomisation — not a recommendation.
Trend & Price Action
The structure is clean. The price sits above both the 20-day average at 162.88 and the 50-day average at 153.80, and the 20-day average rose 2.10% over five days. When a short-term average climbs while holding above a longer one, buyers have been paying up consistently rather than in a single burst. No new moving-average crossover has formed, so the trend is established rather than freshly turned.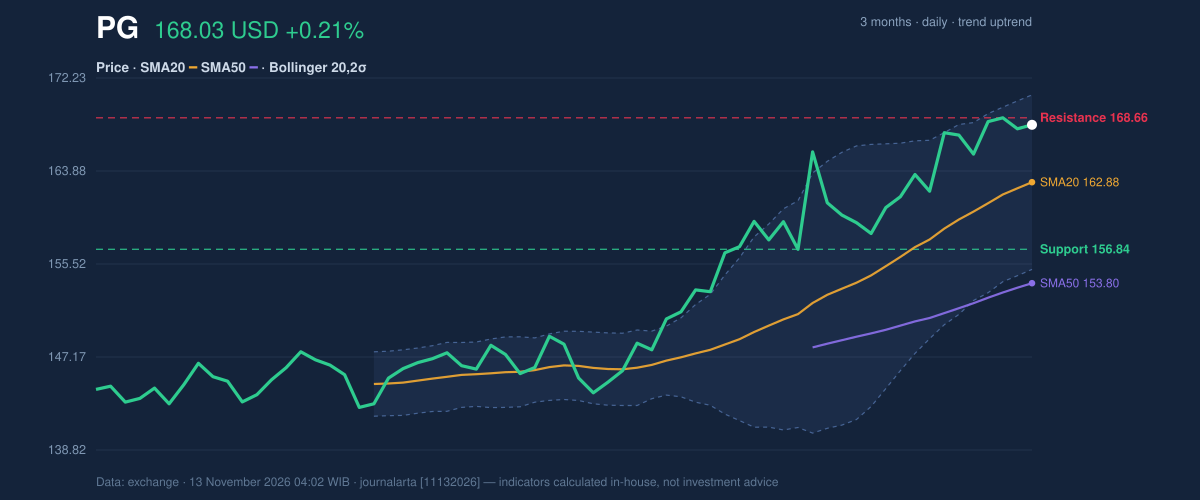
Oscillators & Momentum
Momentum confirms the trend without flashing alarm. The 14-day RSI, which measures the speed of recent gains on a 0-to-100 scale, reads 65.9, below the 70 level usually associated with overheating. The MACD line stands at 4.193 against a signal line of 4.006, a histogram of 0.186. That narrow positive gap shows upward momentum is intact but not accelerating. The Stochastic oscillator is the cautionary note. Its %K reads 81.0 and %D 81.7, both in overbought territory. This gauge compares the close with the recent trading range, so a high reading says the stock is finishing near its highs. In a trend that can persist, but it also means the near-term move has less slack.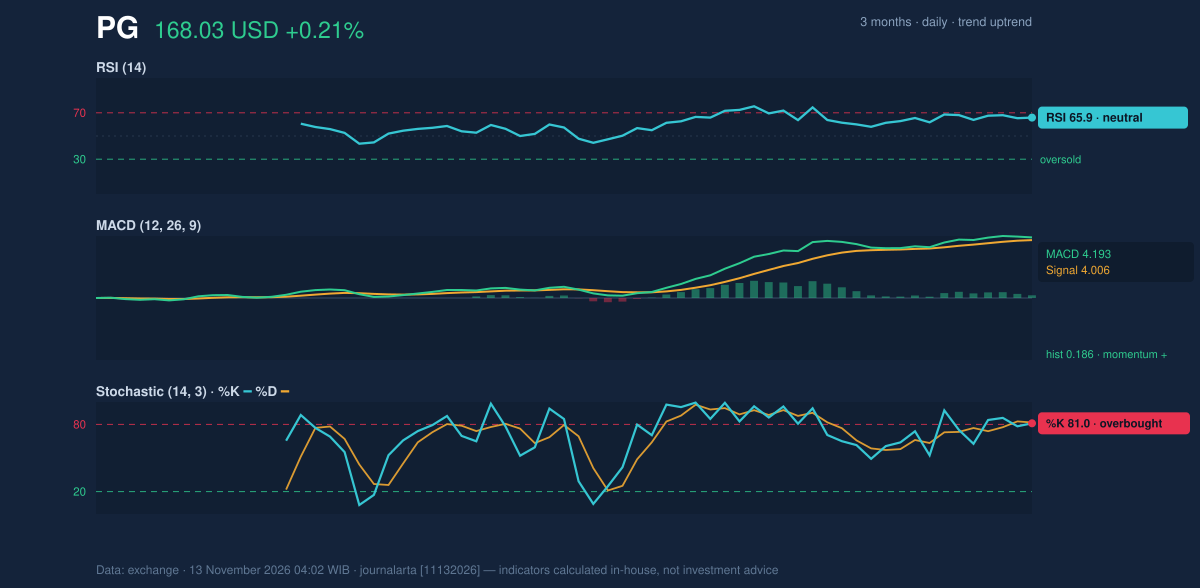
Volatility & Volume
Bollinger Bands, drawn two standard deviations around the 20-day average, run from 155.04 to 170.71. The price sits at 83% of that band, close to the upper edge, with band width at a normal 9.6%. There is no squeeze that would signal a coming breakout. The 14-day average true range of 3.23, or 1.9% of the price, points to moderate daily swings of roughly three dollars. Volume tells a quieter story. Thursday's 7.17 million shares were only 0.7 times the 20-day average of 10.4 million. A push toward highs on thin trading carries less conviction. Still, on-balance volume, which tallies volume on up days against down days, is rising, so the accumulation of recent weeks has not reversed.Fundamental Context
According to its SEC filing, Procter & Gamble reported quarterly revenue of $23.28 billion for the quarter ended September 30, up 4.0% from $22.39 billion a year earlier (Form 10-Q filed October 22). Net income was $4.73 billion, against $4.75 billion a year earlier, with diluted earnings per share of $1.97. Revenue grew while profit was essentially flat. The company also filed Form 8-Ks on November 2 and November 3 reporting other material events.Key Levels & Scenarios
A sustained close above resistance at 168.66 would put the three-month high of 170.52 in play, with the upper Bollinger band at 170.71 sitting just beyond it. If the stock fails to hold, the first cushion is the 20-day average at 162.88, followed by support at 156.84. Thin volume argues for watching whether any breakout is joined by heavier trading.Technical Verdict: BUY
JournalArta's research model scores PG at +68 on a scale of −100 to +100, above the +60 threshold for a BUY call. The strongest reasons: - The price sits above the 50-day average and the 20-day average sits above it, confirming an uptrend. - RSI at 65.9 is in the constructive 50–70 zone without reaching overbought. - On-balance volume is rising, confirming the trend with participation. Levels from the model, valid until December 11, 2026: - Entry range: 165.62 – 168.03 - Exit targets: target 1 at 176.26; target 2 at 184.50 - Stop loss: 162.54 - Reward/risk: 1.5 to target 1; 3.0 to target 2 The verdict is invalidated if the price falls below 162.54, which would also take it under the 20-day average at 162.88. The overbought Stochastic at 81.0 is the main risk to near-term follow-through. In plain terms: the price pattern favors further gains, but the stock is already near the top of its recent range, so the support levels matter. This is technical analysis, not an investment recommendation. | Indicator | Value | |---|---| | Last price | $168.03 | | 1-day / 5-day / 1-month change | 0.21% / 0.56% / 6.97% | | SMA20 / SMA50 | 162.88 / 153.80 | | Bollinger (upper / middle / lower) | 170.71 / 162.88 / 155.04 | | RSI(14) | 65.9 | | Stochastic %K / %D | 81.0 / 81.7 | | MACD / signal / histogram | 4.193 / 4.006 / 0.186 | | ATR(14) | 3.23 | | Support / resistance (20-day) | 156.84 / 168.66 | | 3-month high / low | 170.52 / 141.86 | Procter & Gamble's verdict stays valid until December 11, 2026.Summary Data PG
| Last price | 168.03 USD |
| Change 1 day / 5 days / 1 month | 0.21% / 0.56% / 6.97% |
| Trend / MA-cross | uptrend / none |
| SMA20 / SMA50 | 162.88 / 153.80 |
| RSI (14) / Stochastic %K | 65.9 / 81.0 |
| Bollinger %B / ATR | 83% / 3.23 |
| Support / Resistance 20 days | 156.84 / 168.66 |
| Data as of | 13 November 2026 04:02 WIB |
| JournalArta research verdict (score) | Buy (+68) |
| Entry zone | 165.62 – 168.03 |
| Target 1 / 2 | 176.26 / 184.50 |
| Stop loss | 162.54 |
| Reward/risk | 1.5 / 3.0 |
Today's full Buy and Sell list for US stocks →
Disclaimer: This technical analysis is generated automatically from exchange data and indicators calculated by JournalArta, for information and education only. The verdict and the entry, target and stop-loss levels are not investment advice or a solicitation to buy or sell any security. Investment decisions and their risks rest solely with the reader.
Track PG stock price daily: live levels, support/resistance and our full PG analysis history.