Alibaba Stock Gains 0.54%, Testing Key Resistance In Focus
Technical analysis of Alibaba stock on Juli 15, 2026: price 110.80 HKD, trend sideways, RSI 56.2, support 89.50, resistance 110.70. Key angle: Alibaba Stock…

Alibaba Group (9988.HK) shares closed at 110.80 HKD in the most recent trading session, marking a subtle 0.54% uptick that masks a broader, more aggressive volatility recovery. Following a staggering 15.48% gain over the last five trading days, the stock is testing the upper boundaries of its current range. Investors are currently weighing whether this sharp reversal indicates a structural trend shift or merely a reaction to extreme oversold conditions experienced in the preceding weeks.
Trend and Price Action
Alibaba’s price structure is currently transitioning from a period of stagnation into a phase of high-volatility expansion. Trading at 110.80 HKD, the stock has successfully reclaimed its SMA20 (101.33 HKD), a critical threshold that serves as the immediate foundation for current bullish sentiment. However, the shadow of the SMA50 (117.16 HKD) looms overhead, acting as the primary medium-term resistance level that the stock has yet to breach. The price now sits at the top of its 20-day range, effectively testing the resistance level of 110.70 HKD, which it eclipsed marginally in the latest session.
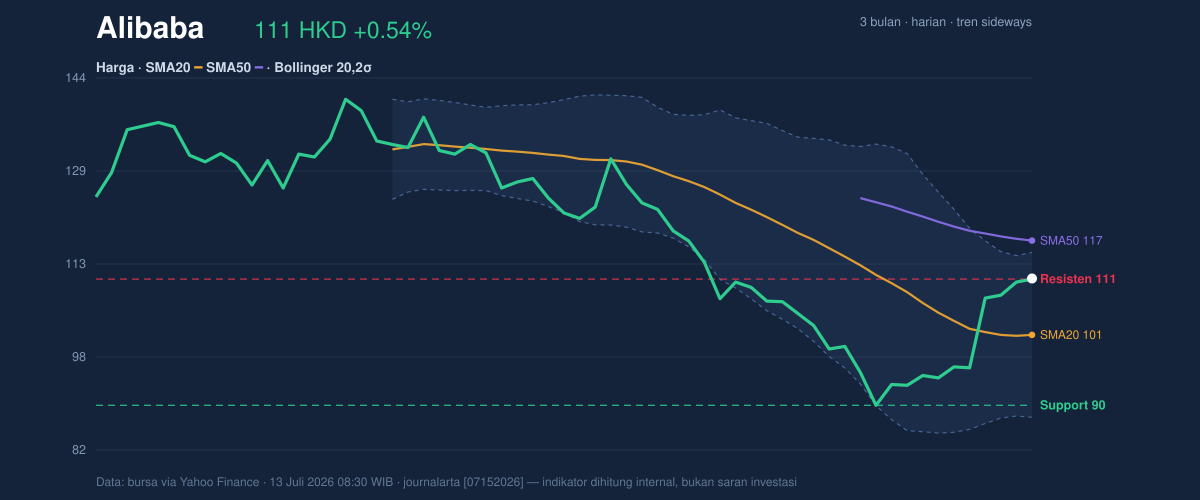
The widening of the Bollinger Bands—currently sitting at a width of 27.3%—suggests that the market is entering a phase of heightened uncertainty, where price swings of 4-5% (as indicated by the ATR of 5.32) are becoming the new standard.
Momentum and Oscillators
The momentum profile reveals a nuanced picture of the current rally. The MACD is currently at -2.934, positioned below the signal line but maintaining a positive histogram at 2.713, suggesting that while the long-term trend remains pressured, the immediate buying force is gaining strength. However, this is tempered by the Stochastic oscillator at 83.4 / 83.9, which has crossed into overbought territory.
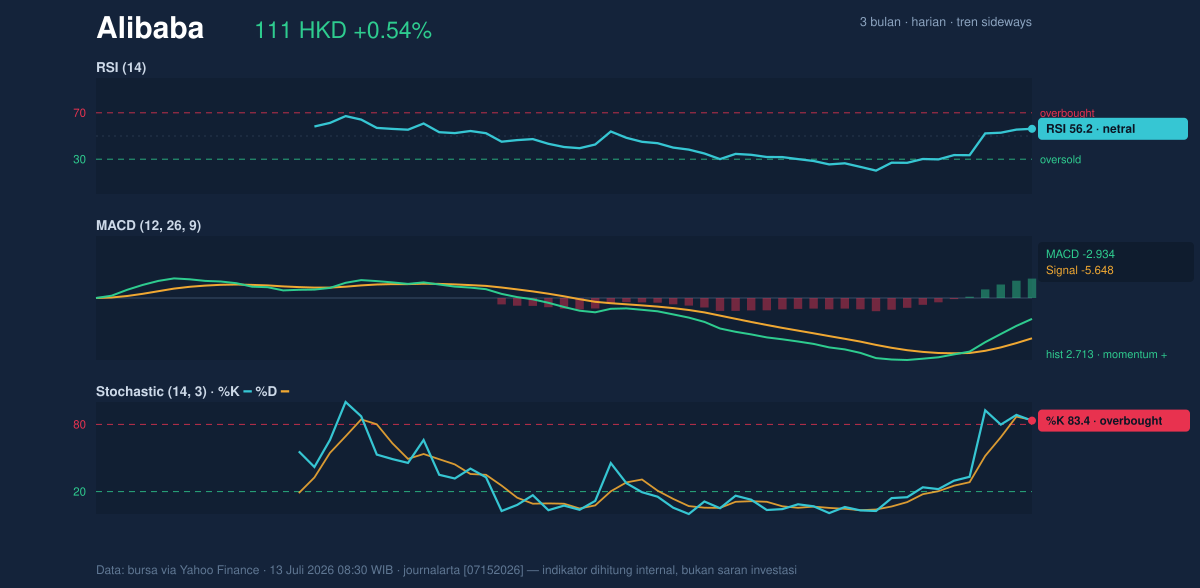
The RSI(14) at 56.2 confirms a neutral-to-bullish stance; it is not yet in the extreme overbought zone (typically above 70), which provides some breathing room for the current momentum to continue, provided the buying participation remains steady. Notably, the OBV (On-Balance Volume) is trending upward, signaling that the recent price surge is backed by genuine accumulation rather than a mere lack of sellers.
Volatility and Liquidity
The volume dynamics are the most curious aspect of Alibaba's current technical setup. Despite the rapid 15.48% climb over the past week, the volume of 100.489 million remains below the 20-day average of 116.113 million, registering at approximately 0.9x normal levels. This divergence—a rising price on below-average volume—often suggests that the current rally is driven by a lack of supply rather than an overwhelming surge in institutional demand. Traders are cautious, waiting for a definitive breakout above the 110.70 HKD resistance before committing significant capital.
Technical Verdict: HOLD (wait & see)
The verdict is a HOLD (wait & see), predicated on the following signals:
* Stochastic Overbought: The indicator shows the asset is technically stretched in the very short term, increasing the risk of a minor retracement.
* Volume Divergence: The lack of confirmed high-volume participation during the 15.48% rally necessitates caution against a potential "bull trap."
* Resistance Proximity: The stock is battling both the 110.70 HKD resistance and the approaching 117.16 HKD SMA50, creating a crowded zone for buyers.
* Verdict invalidated if price breaks: A sustained close above 117.16 HKD with rising volume would shift the outlook toward a momentum breakout.
* Ideal Entry Range: 101.33 HKD – 105.00 HKD (retest of SMA20).
* Exit Target (Resistance): 117.16 HKD.
* Stop Loss Protection: 97.50 HKD (below the support convergence zone).
This technical assessment represents a snapshot of current market dynamics and does not constitute financial advice.
The company is scheduled to report its next set of financial results in the upcoming quarter.
Summary Data Alibaba
| Last price | 110.80 HKD |
| Change 1 day / 5 days / 1 month | 0.54% / 15.48% / 3.17% |
| Trend / MA-cross | sideways / none |
| SMA20 / SMA50 | 101.33 / 117.16 |
| RSI (14) / Stochastic %K | 56.2 / 83.4 |
| Bollinger %B / ATR | 84% / 5.32 |
| Support / Resistance 20 days | 89.50 / 110.70 |
| Data as of | 13 Juli 2026 08:30 WIB |



