VZ Stock Gains 2.71% Today, Momentum Gains
On Agustus 4, 2026: price 47.36 USD, trend sideways, RSI 58.8, support 42.07, resistance 48.19. technical analysis of vz stock. VZ Stock Gains — full details…

Verizon Communications rose to 47.36 USD on the NYSE after a 2.71% daily gain, extending a one-month advance of 11.28% and pushing the shares close to the upper edge of their recent trading band. The move matters because it shows the stock is not just bouncing for a day; it is spending more time in the upper half of its range, where traders usually start asking whether momentum can carry through resistance or whether the rally is getting ahead of itself.
Trend & Price Action
The broader structure is still best described as sideways, but that label does not mean static. The SMA20 at 44.22 is rising, with a 2.09% slope over five days, and the share price is sitting above the SMA20 and also above the SMA50 at 45.47. That positioning tells us the short-term trend has improved inside a larger range: buyers have been willing to pay up above both moving averages, but the lack of a new MA-cross suggests the market has not yet produced a decisive long-term trend break.
As shown in the chart, the stock is trading near the top of its recent envelope rather than in the middle of it.
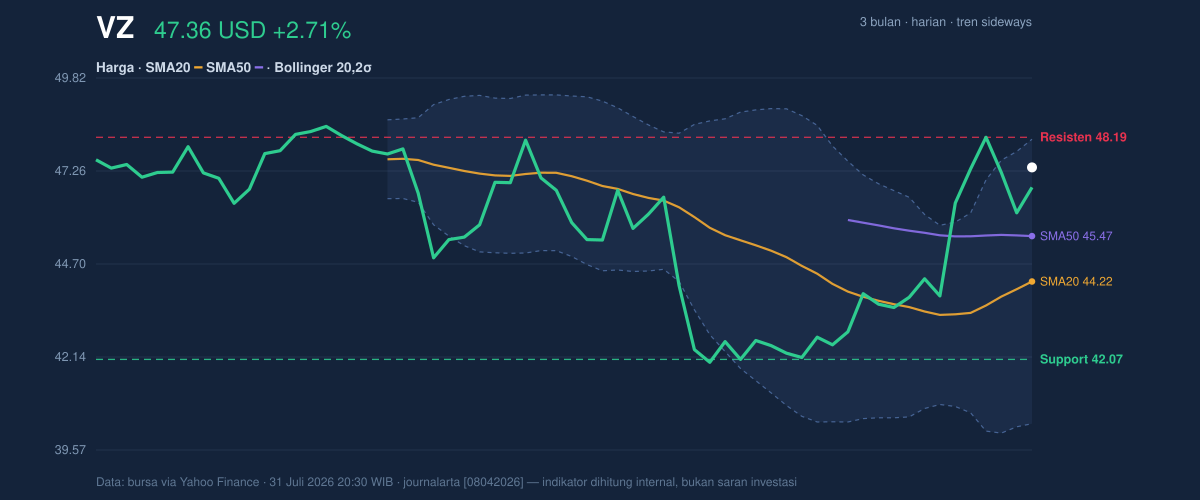
The Bollinger setup reinforces that message. Price is near the upper band at 48.14, with %B at 90%, which means the shares are pressing into the top tenth of the banded range. In plain language, that is a sign of strength, but also of compression risk: the stock is closer to where upside gets tested than where it is comfortably coasting. The band width is 17.7%, described as normal, so this is not a volatility breakout regime yet; it is a controlled climb rather than a sudden expansion.
Oscillators & Momentum
The momentum picture is constructive, but not overheated. RSI at 58.8 is neutral, which matters because it says the stock has room to keep rising without immediately entering an overbought zone. Stochastic %K at 67.6 and %D at 67.2 are also neutral and closely aligned, a sign that short-term momentum is still pointed upward without flashing a reversal warning. That alignment is important: when stochastic lines move together in the upper-middle range, it usually signals steady participation rather than a speculative spike.
The strongest technical signal comes from MACD.
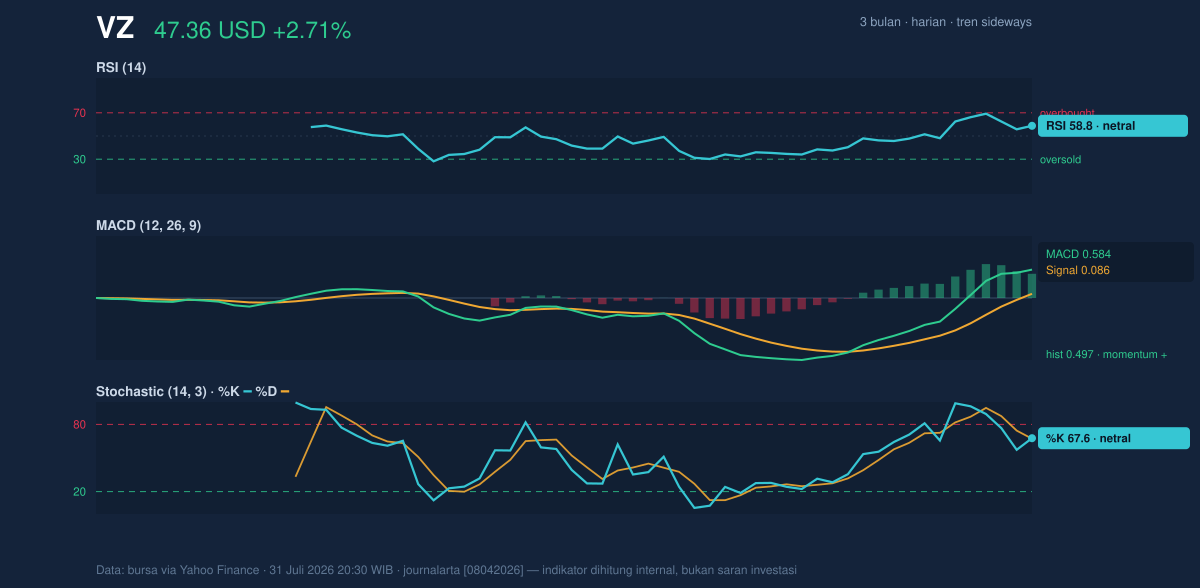
MACD at 0.584 sits well above the signal line at 0.086, and the histogram at 0.497 is positive. For readers, that means the stock’s recent price trend is still accelerating relative to its recent average. It does not guarantee continuation, but it does show that the rally has internal support rather than being driven by a single session of enthusiasm. In market terms, momentum is confirming price, not fighting it.
Volatility & Volume
Volatility is moderate. ATR at 1.42, or 3.0% of price, indicates the stock is moving enough to create meaningful daily swings, but not enough to suggest disorderly trading. That is a useful context for the current setup: when a stock trades near resistance with moderate ATR, small follow-through moves can matter because they may decide whether price stays pinned near the top of the range or slips back toward the middle.
Volume does not yet show a dramatic surge, but it is adequate. The latest volume of 28,291,300 is essentially in line with the 28,777,245 average over 20 hours, or 1.0× normal. That tells us the advance is being accepted by the market, but not yet accompanied by a broad rush of new participation. The rising OBV, or on-balance volume, is the more encouraging detail here: it suggests shares have been accumulating even without a big volume spike, which often supports a move better than a one-day burst does.
Key Levels & Scenarios
The immediate technical map is clear. Support at 42.07 marks the lower edge of the 20-hour range, while resistance at 48.19 sits just above the current price and very close to the 48.14 Bollinger upper band. Price is already at 86% of the recent range, so the market is effectively testing the ceiling rather than building from the floor. The 3-month high at 49.01 is the next reference above that ceiling, and the 3-month low at 40.76 shows how far the stock has already moved away from its weaker zone.
In practical terms, if the shares clear 48.19, the chart would be signaling that buyers have absorbed the nearby resistance and are attempting to probe the 49.01 area. If price fails there, the more likely pullback zone is back toward the 44.22 SMA20, where trend followers may look to see whether the recent breakout attempt was real or just a short-lived extension.
Technical Verdict: HOLD (wait & see)
- MACD is positive and above signal, showing momentum is still favorable.
- Price is above both SMA20 and SMA50, which supports the short-term trend.
- %B at 90% and price near 48.19 resistance mean the stock is extended enough that follow-through is not guaranteed.
Verdict invalidated if price breaks below 42.07, because that would mean the recent range support has failed and the current constructive setup has weakened materially.
- Ideal Entry Range: 44.22 to 45.47
- Exit Target: 48.19 to 49.01
- Stop Loss Protection: 42.07
In plain English: Verizon’s chart is still healthy, but it is now close enough to resistance that the next move will matter more than the last one.
“Right now the stock is asking a simple question of the market: can it finally push through the ceiling, or will this be where the rally runs out of room?”
Summary Data VZ
| Last price | 47.36 USD |
| Change 1 day / 5 days / 1 month | 2.71% / 2.11% / 11.28% |
| Trend / MA-cross | sideways / none |
| SMA20 / SMA50 | 44.22 / 45.47 |
| RSI (14) / Stochastic %K | 58.8 / 67.6 |
| Bollinger %B / ATR | 90% / 1.42 |
| Support / Resistance 20 days | 42.07 / 48.19 |
| Data as of | 31 Juli 2026 20:30 WIB |
Track VZ stock price daily: live levels, support/resistance and our full VZ analysis history.


