AMD Stock Gains 1.82% Today, Momentum Weakens
On Agustus 13, 2026: price 482.93 USD, trend downtrend, RSI 47.3, support 429.56, resistance 552.33. technical analysis of amd stock. AMD Stock Gains — full…

AMD is still trading in a market that rewards speed, but the chart says that speed has recently gone missing: the shares finished at USD 482.93 on Nasdaq, up 1.82% on the day, yet still below the short- and medium-term trend markers that matter most. For international readers, that means the stock can bounce in a session without yet proving that the broader slide has ended.
AMD’s latest move needs to be read against the larger pattern. The stock remains in a downtrend, and the slope of the SMA20 is -3.11% over five days, which is a clear sign that short-term momentum is still tilting lower. Price is also sitting below the SMA20 at 494.20 and well under the SMA50 at 511.73, so the market is not yet reclaiming the levels that usually separate a routine pullback from a more constructive reversal. There has been no fresh MA cross, which matters because moving-average crossovers often act as a simple confirmation that buyers have regained control; without that signal, the burden of proof remains on the bulls.
Trend & Price Action
The stock’s position inside its recent range is more telling than the one-day gain. AMD is trading at about 43% of the 20-hour range, with support at 429.56 and resistance at 552.33. That middle-lower placement suggests the market is not pricing in a decisive recovery, but neither is it in a panic zone. The broader three-month band, from 393.36 to 584.73, shows how much ground the shares have already given back from the upper part of the range. In practical terms, the chart is telling investors that AMD is still trying to find a floor rather than pressing into a clean breakout.
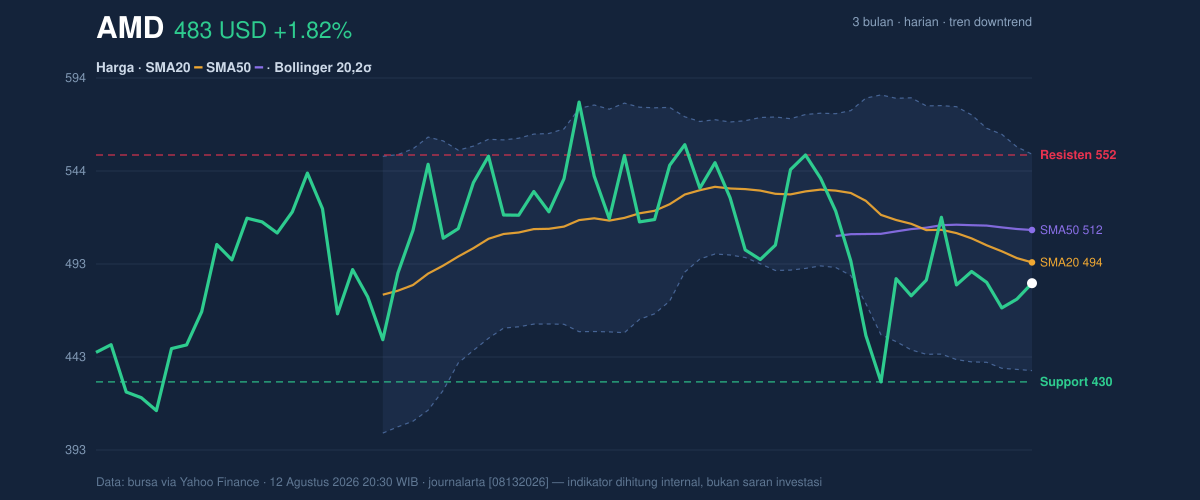
The Bollinger setup reinforces that message. Price is below the middle band, which sits at 494.20, and the %B reading of 40% means AMD is below the midpoint of its recent volatility envelope, not near the upper band where strong upside momentum would usually show up. The bands are also wide at 23.7%, and that widening matters: it signals the market is allowing for larger swings, often a sign that uncertainty is elevated rather than settled. With the upper band at 552.74 and the lower band at 435.67, the stock is trading closer to the lower half of that corridor, which keeps the defensive tone intact.
Oscillators & Momentum
Momentum indicators are not confirming a reversal yet, but they are also not screaming oversold. The RSI(14) at 47.3 is neutral, which means the stock is neither stretched to the downside nor showing the kind of strength that usually accompanies a sustained rebound. The Stochastic %K at 47.1 and %D at 39.4 is also neutral, with no strong crossover signal that would hint at an immediate momentum turn. In plain language, the short-term gauges are saying AMD has stopped falling hard, but they are not yet saying it has started trending up with conviction.
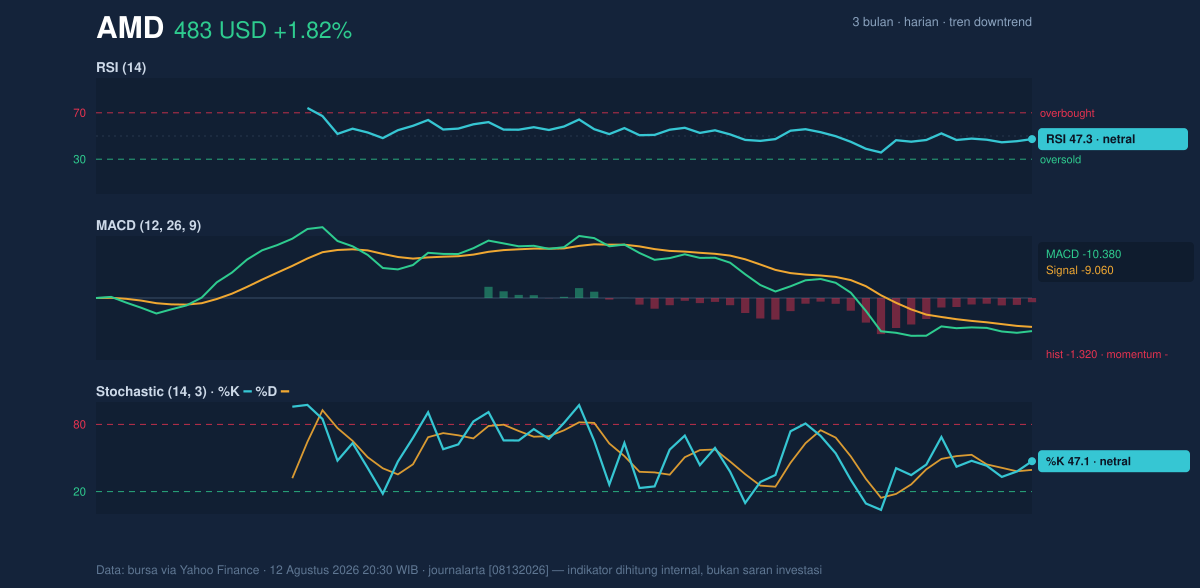
The clearest caution comes from MACD. AMD’s MACD is -10.380, below the signal line at -9.060, with a histogram of -1.320. That combination points to negative momentum still outweighing positive acceleration. Traders often watch for MACD to move above the signal line as a sign that downward pressure is fading; here, the opposite remains true. So while the RSI and Stochastic are neutral, MACD says the stock has not yet earned a momentum reset.
Volatility & Volume
Volatility is elevated. The ATR(14) of 35.17, equal to 7.3% of price, means AMD can move sharply in either direction without much warning. That is important because a stock with high ATR can appear stable for several sessions and then suddenly reprice quickly once a level gives way. The recent volume of 18,584,500 was only 0.6x normal versus the 20-hour average of 29,244,515, which implies the latest bounce did not come with full participation. In other words, the move higher was not backed by the kind of trading intensity that usually gives a reversal more credibility.
At the same time, OBV is rising, which is a constructive detail. On-balance volume tracks whether volume is flowing into the stock or out of it, and a rising OBV can mean buyers are quietly accumulating even when the headline volume is soft. That creates a mixed picture: participation on the day was muted, but the broader volume trend has not fully turned against AMD.
Key Levels & Scenarios
The chart’s nearest reference points are straightforward. Support at 429.56 is the first level where buyers would be expected to defend the tape. If that floor fails, the lower Bollinger band at 435.67 becomes the next closely watched zone, though the broader message would be that the downtrend is still in control. On the upside, the first meaningful hurdle is the SMA20 at 494.20, followed by the SMA50 at 511.73 and then resistance at 552.33. Those levels matter because each one represents a different layer of skepticism the stock must overcome: short-term trend, medium-term trend, and recent range ceiling.
If AMD can reclaim 494.20 and hold above it, the chart would begin to look less defensive. If it fails to do so, the stock remains stuck below the line that often separates a bounce from a trend change. The key point is that the market has not yet chosen a side with conviction.
Technical Verdict: HOLD (wait & see)
HOLD (wait & see)
- MACD remains negative, with the histogram still below zero, so downside momentum has not fully cleared.
- Price is below the SMA20 and SMA50, which keeps the broader trend structure bearish despite the daily bounce.
- RSI and Stochastic are neutral, suggesting the stock is not oversold enough to signal a clean reversal.
Verdict invalidated if price falls below 429.56, because that would weaken the nearest support and increase the odds of another leg lower.
- Ideal entry range: 429.56 to 494.20
- Exit target: 511.73 to 552.33
- Stop loss protection: below 429.56
For non-traders, this means AMD is not broken, but it has not yet proved it has turned the corner. “It’s a stock waiting for confirmation, not one that has already given it.”
Summary Data AMD
| Last price | 482.93 USD |
| Change 1 day / 5 days / 1 month | 1.82% / 0.18% / -8.73% |
| Trend / MA-cross | downtrend / none |
| SMA20 / SMA50 | 494.20 / 511.73 |
| RSI (14) / Stochastic %K | 47.3 / 47.1 |
| Bollinger %B / ATR | 40% / 35.17 |
| Support / Resistance 20 days | 429.56 / 552.33 |
| Data as of | 12 Agustus 2026 20:30 WIB |


