AMD Stock Gains 1.45%, Momentum Weakens In Focus
On Juli 23, 2026: price 552.33 USD, trend sideways, RSI 56.2, support 495.76, resistance 580.91. technical analysis of amd stock. AMD Stock Gains — full…

International investors are watching AMD’s tape because the stock is still climbing inside a broad range, but the signals underneath that move are no longer fully aligned.
Advanced Micro Devices closed at 552.33 USD, up from 544.43 the previous session, and the shares have gained 1.45% in one day, 4.38% over five days and 6.25% over one month, according to the latest market data via Yahoo Finance. That places the stock comfortably above its short- and medium-term moving averages, yet not in a clean trend: the chart still describes a sideways pattern, with the SMA20 at 532.59 and SMA50 at 505.39. In plain terms, AMD is holding above its recent average price, which is constructive, but the lack of a fresh moving-average crossover means the market has not yet committed to a stronger directional breakout.
Trend & Price Action
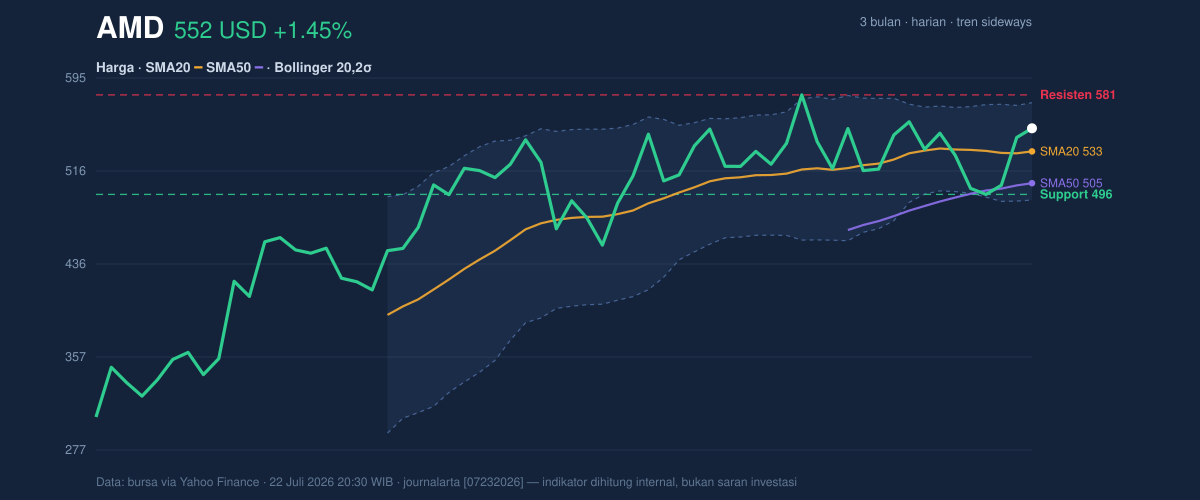
As shown in the chart, the price is trading above the SMA20 and well above the SMA50, which usually tells traders that the intermediate trend still has support from prior buying. The problem is that the slope of the SMA20 is -0.30% over 5 days, a subtle sign that the recent upswing is losing some momentum even as the price remains elevated. That is why the setup looks more like consolidation than acceleration.
The broader range matters too. AMD is sitting near the upper half of its recent band, with 20-hour support at 495.76 and 20-hour resistance at 580.91, and the stock is positioned around 66% of that range. That tells readers the market is closer to the ceiling than the floor, so upside progress now depends on whether buyers can push through the next pocket of supply rather than simply defend prior gains. The 3-month high of 584.73 sits just above current resistance, which makes that area important: it is not just a number, it is the point where recent optimism either becomes a breakout or stalls.
Bollinger Bands add another layer. The price is below the upper band at 574.22, above the middle band at 532.59, and the %B of 74% shows AMD is trading in the upper portion of its volatility envelope. That usually means the stock has room to test higher levels, but it is also close enough to the upper band that momentum traders may start taking profits if the move slows. The 15.6% band width is normal, not compressed, so this is not a classic “spring-loading” setup for a sudden volatility burst.
Oscillators & Momentum
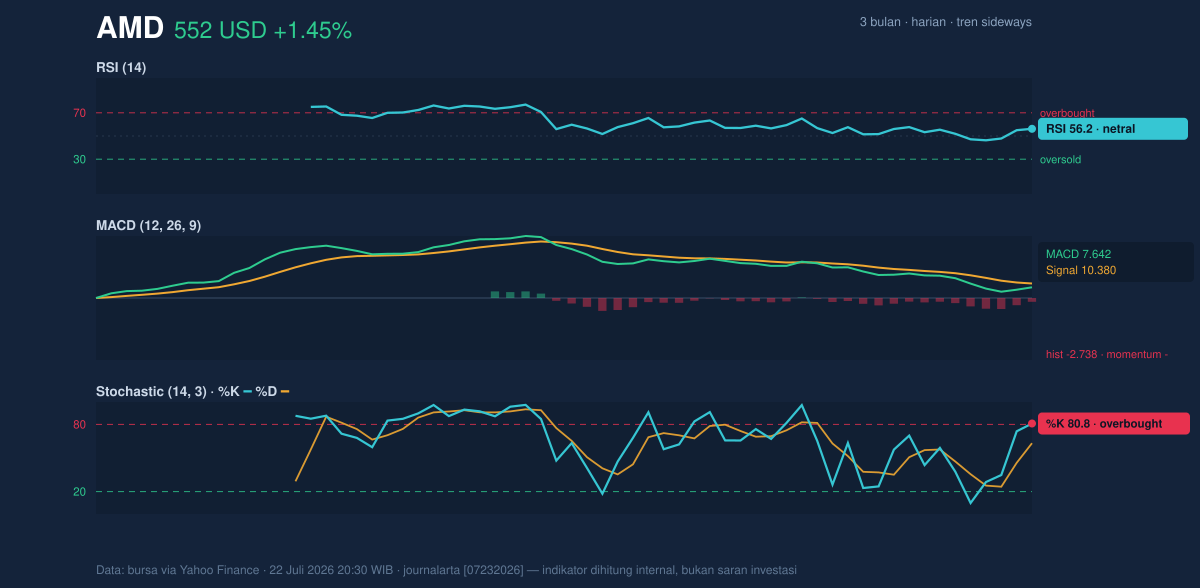
The momentum picture is more mixed than the price chart suggests. RSI at 56.2 is neutral, which means the stock is neither overextended nor washed out. That is important because it shows the rally has not yet reached a technical exhaustion point. But the stochastic oscillator is more stretched: %K at 80.8 and %D at 63.2 place it in overbought territory, a sign that the latest push has been strong enough to crowd the short-term trade. In practical terms, overbought does not mean an immediate reversal; it means the stock may need a pause or a pullback before extending higher.
The MACD is the clearest warning signal. MACD at 7.642 is below the signal line at 10.380, and the histogram at -2.738 confirms negative momentum. That matters because MACD is designed to show whether the trend is gaining or losing force. Here, price is still holding up, but the internal engine is not running as strongly as the chart headline implies. When price stays firm while MACD weakens, traders often see it as a caution that the move may be maturing.
Volatility & Volume
Volatility remains a meaningful factor. The ATR(14) at 38.69, equal to 7.0% of price, says AMD can still swing sharply in either direction on a normal trading day. For readers outside market jargon, ATR is a measure of typical daily movement; a higher reading means wider intraday swings and less certainty about where the close will land. That supports a view of AMD as a stock where price can move quickly once a level gives way.
Volume is less emphatic. Last session’s volume was 24,691,200, below the 20-hour average of 28,175,495, or about 0.9× normal. That means the recent rise has not yet been backed by unusually heavy participation. In other words, the market is not showing strong urgency. Still, OBV is rising, which suggests the longer-term balance of buying pressure is improving even if the latest session was not a volume surge. That combination often points to accumulation, but not necessarily to immediate breakout conviction.
Key Levels & Scenarios
The market is now balancing between a near-term ceiling and a deeper support zone. Resistance at 580.91 is the first obvious test, and it sits close to the 3-month high of 584.73. If AMD can clear that area with stronger volume, the chart would shift from range-bound to more directional. If it fails, the stock may drift back toward the middle Bollinger band at 532.59, where the latest trend support lives.
On the downside, support at 495.76 is the line that matters most in the current setup. A break below that area would weaken the case that the recent advance is merely pausing. Because the price is already above both moving averages, a fall through support would signal that the market has stopped rewarding the current bounce and is willing to revisit the lower part of the range.
Technical Verdict: HOLD (wait & see)
HOLD (wait & see) is the cleanest reading from the indicators because price is constructive, but momentum is not fully confirming.
- Reason 1: Price remains above the SMA20 at 532.59 and SMA50 at 505.39, which keeps the broader structure intact.
- Reason 2: MACD is negative versus its signal line, showing the rally is losing internal force even as price holds up.
- Reason 3: Stochastic is overbought while volume is only 0.9× normal, so the move lacks strong confirmation.
- Verdict invalidated if price breaks below 495.76, because that would undercut the nearest support and weaken the current range structure.
- Ideal Entry Range: 532.59 to 495.76
- Exit Target (Target Price): 574.22 to 580.91
- Stop Loss protection: below 495.76
In plain English: AMD still looks technically healthy, but the chart is asking for confirmation before the next meaningful move. “The stock is holding up, but the momentum is not yet telling the same story,” one trader said, “and that is exactly where the market can turn fast.”
Summary Data AMD
| Last price | 552.33 USD |
| Change 1 day / 5 days / 1 month | 1.45% / 4.38% / 6.25% |
| Trend / MA-cross | sideways / none |
| SMA20 / SMA50 | 532.59 / 505.39 |
| RSI (14) / Stochastic %K | 56.2 / 80.8 |
| Bollinger %B / ATR | 74% / 38.69 |
| Support / Resistance 20 days | 495.76 / 580.91 |
| Data as of | 22 Juli 2026 20:30 WIB |

