WMT Stock Analysis: Gains 2.43%, Testing Key Resistance
On Agustus 13, 2026: price 116.01 USD, trend sideways, RSI 58.6, support 108.40, resistance 116.01. technical analysis of wmt stock. WMT Stock Analysis — full…

International investors are watching Walmart as its shares press into the top of a narrow trading band, a move that says as much about sentiment as it does about the business.
Walmart (NYSE: WMT) closed at 116.01 USD, up 2.43% on the day, extending a 3.27% gain over five days and 3.09% over one month, according to Yahoo Finance data cited at 12 August 2026 20:30 WIB. The immediate message is not a dramatic trend change, but a market that is testing the upper edge of its recent range while broader technical signals remain mixed. That combination matters: it often marks the difference between a clean continuation and a short-lived push.
Trend & Price Action
The chart shows Walmart in a sideways trend, not a decisive uptrend, even though price is sitting above the SMA20 at 112.04 and also above the SMA50 at 114.47. That positioning is constructive because it tells us the stock is trading above both its short- and medium-term averages, which often acts as evidence that buyers still control the tape on a tactical basis.
Still, the slope of the SMA20 is -0.06% over five days, a small but important detail. It means the short-term average is drifting lower, which usually reflects consolidation rather than strong upward acceleration. In plain language, the stock is holding up, but it is not yet showing the kind of rising average that would confirm a firmer trend.
The Bollinger Bands add another layer. Price is at the upper band at 115.80, with %B at 103%. That means the share price has moved slightly beyond the band, a sign of strength, but also one that can sometimes precede a pause if momentum cools. At the same time, the band width of 6.7% is narrowing, which points to a squeeze. A squeeze often means the market is storing energy for a larger move, though it does not tell direction on its own.
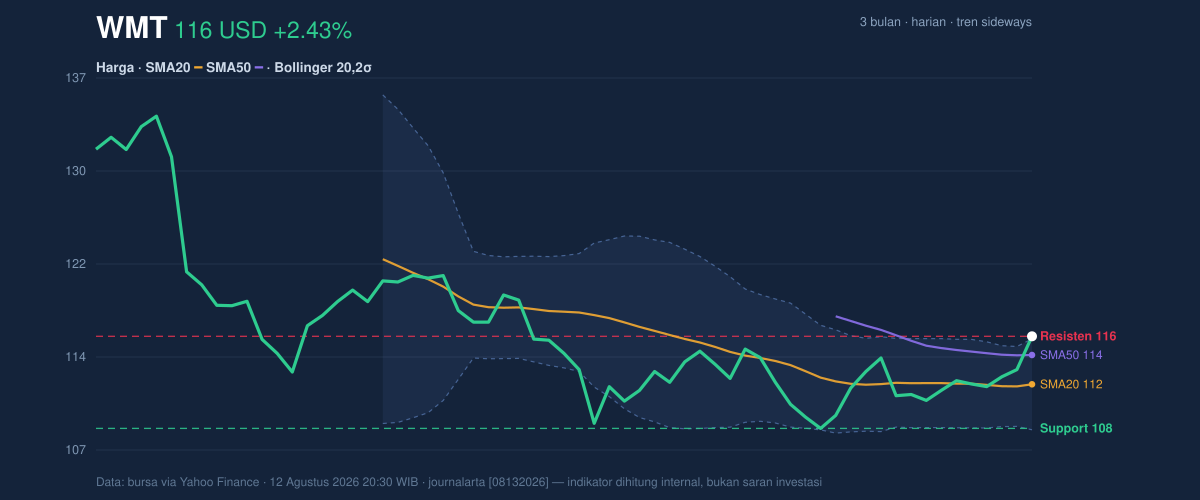
The most immediate reference points are clear. Resistance sits at 116.01, which is effectively the current price, while support is 108.40 on the 20-hour range. That means Walmart is trading at the top of its short-term range, near a zone where traders will want confirmation rather than assumption. The stock is also still below its 3-month high of 135.16 and above its 3-month low of 106.79, leaving room for either side of the range to reassert itself.
Oscillators & Momentum
Momentum is less straightforward than price action. The RSI(14) at 58.6 is neutral, which suggests the stock is not yet overextended on a broad momentum basis. That is a healthy reading for a stock sitting near resistance because it means there is still room before the market becomes technically stretched.
The short-term oscillator picture is hotter. Stochastic %K at 99.5 and %D at 77.7 place the stock in overbought territory. In practical terms, Stochastic is saying the share price has advanced quickly relative to its recent range and may be due for a pause or a pullback if buyers do not keep pressing. Overbought does not mean a reversal is guaranteed; it means the move has become fast enough that the market may need to cool.
The MACD, however, is still on the bullish side. MACD at -0.284 is below zero, but the signal line at -0.924 is lower still, leaving a positive histogram of 0.640. That matters because the histogram measures the gap between the two lines; a positive reading shows momentum is improving even if the broader MACD line has not crossed into positive territory yet. In other words, the stock is showing a recovery impulse, but not a fully mature trend reversal.
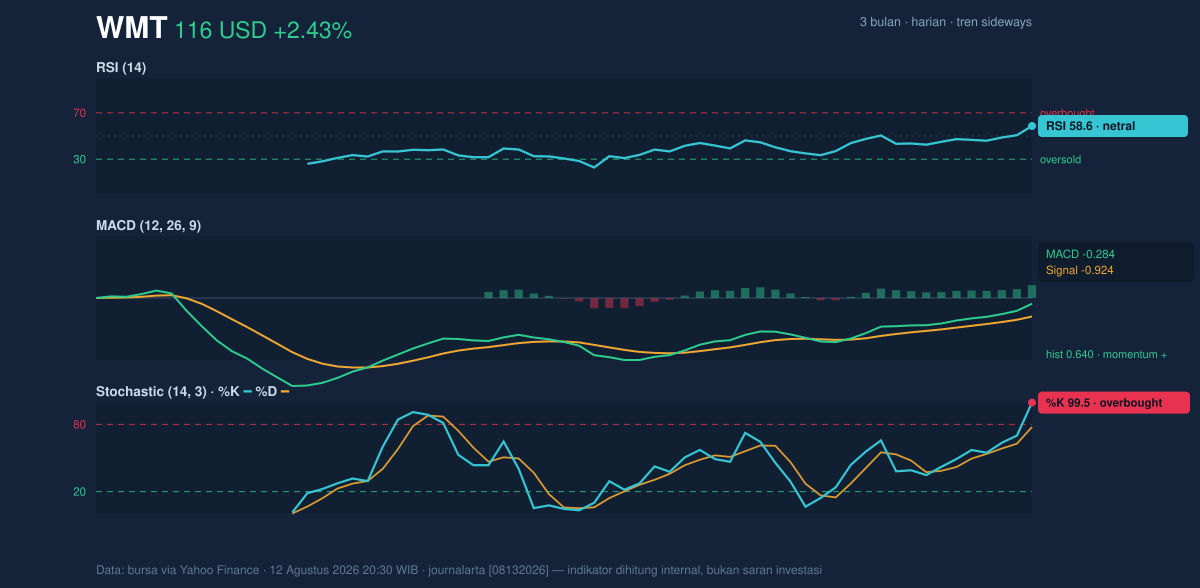
The oscillator mix is therefore split: RSI is neutral, Stochastic is overbought, and MACD is positive. That combination often appears when a stock is rising, but the move is getting extended in the short term. It is a constructive setup, but not a clean, all-clear signal.
Volatility & Volume
Volatility is neither calm nor explosive. ATR(14) at 2.66, or 2.3% of price, indicates moderate daily movement. That is enough to produce meaningful swings, but not enough to suggest panic or disorderly trading. For readers unfamiliar with ATR, it is a measure of how much a stock typically moves in a day; higher values mean wider expected swings.
Volume does offer a useful confirmation. The latest reading of 22,037,500 shares is close to the 20-hour average of 22,353,100, or roughly 1.0x normal. That tells us the latest rise is not being driven by a dramatic surge in participation, but it is also not a thin, untrustworthy move. More encouraging is that OBV is rising. On-balance volume tracks whether volume is accumulating on up days or down days, and a rising OBV suggests that buying pressure has been building underneath the price action.
That is the key signal here: price is testing resistance with volume support, but the market has not yet produced the kind of breakout confirmation that would silence the overbought caution from Stochastic.
Key Levels & Scenarios
The near-term map is straightforward. 116.01 is the first ceiling to watch because it is the current high and the 20-hour resistance. Above that, the next reference is not a new technical level from the data, but the broader context of the 3-month high at 135.16. Below current price, the first meaningful floor is support at 108.40, with the Bollinger middle band at 112.04 acting as an intermediate cushion.
If Walmart can hold above the SMA20 at 112.04 and keep price near or above the upper Bollinger band at 115.80, the chart would continue to favor a bullish bias. If it fails to stay above the short-term range and slips back under 112.04, the move would look more like a failed breakout attempt than a trend extension. A drop through 108.40 would be a more serious sign that the recent advance has lost traction.
Technical Verdict: HOLD (wait & see)
HOLD (wait & see) fits the current setup best because the chart shows strength, but not yet enough confirmation to call it a clean trend breakout.
- Reason 1: Price is above the SMA20 and SMA50, which is supportive.
- Reason 2: MACD histogram is positive at 0.640, showing improving momentum.
- Reason 3: Stochastic is overbought and price is at resistance 116.01, so the move may need to cool before extending.
- Verdict invalidated if price breaks below 108.40, which would mean short-term support has failed.
- Ideal Entry Range: 112.04 to 114.47
- Exit Target: 116.01, with the broader chart context remaining the 3-month high at 135.16
- Stop Loss protection: below 108.40
For non-traders, this means Walmart looks technically steady, but the chart is asking for proof before treating the recent rise as more than a short-term push.
Summary Data WMT
| Last price | 116.01 USD |
| Change 1 day / 5 days / 1 month | 2.43% / 3.27% / 3.09% |
| Trend / MA-cross | sideways / none |
| SMA20 / SMA50 | 112.04 / 114.47 |
| RSI (14) / Stochastic %K | 58.6 / 99.5 |
| Bollinger %B / ATR | 103% / 2.66 |
| Support / Resistance 20 days | 108.40 / 116.01 |
| Data as of | 12 Agustus 2026 20:30 WIB |


