Testing Key Resistance, XOM Stock Gains 1.80% Today
On Agustus 18, 2026: price 161.46 USD, trend uptrend, RSI 63.8, support 148.36, resistance 160.10. technical analysis of xom stock. Testing Key Resistance —…

ExxonMobil rose to 161.46 USD on the NYSE on 14 August 2026, extending a short-term rally that has lifted the stock 1.80% in one day, 5.50% over five days and 9.57% in a month, according to Yahoo Finance data cited at 20:30 WIB. The move leaves XOM pressing against the top of its recent trading band, which matters because stocks often need either stronger participation or a pause when they get this close to resistance.
Trend & Price Action
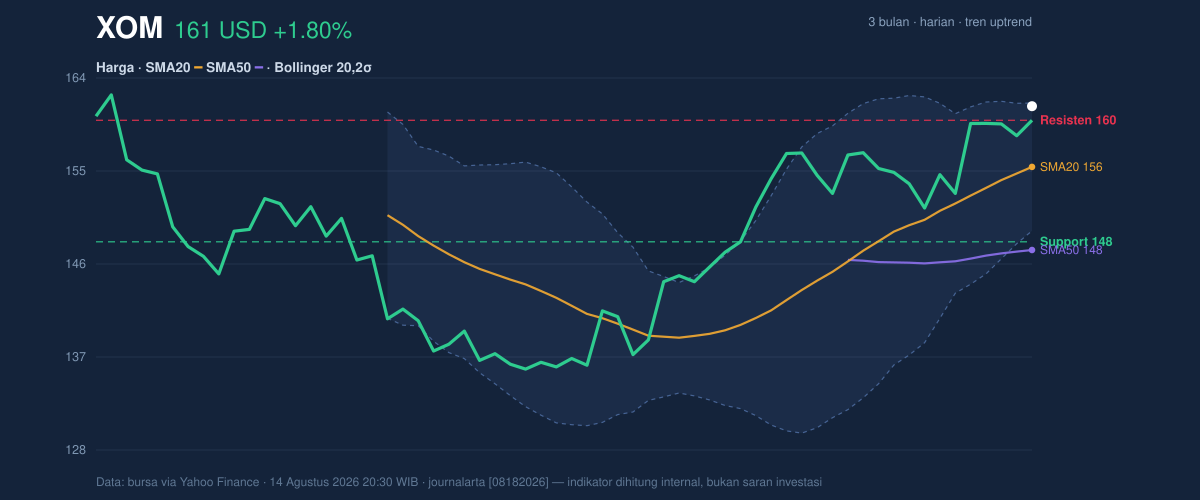
The broader technical picture is constructive. XOM is in an uptrend, and the slope of the SMA20 at 2.32% over five days shows the near-term trend is still rising rather than flattening out. Price is also trading above the SMA20 at 155.60 and well above the SMA50 at 147.57, a simple sign that the stock is not just bouncing, but holding a higher price structure.
That said, the stock is now close to a zone where momentum can become self-limiting. The 20-hour resistance at 160.10 has already been cleared intraday, while the 3-month high at 163.68 sits only a little higher, as shown in the chart. The fact that price is at 112% of the 20-hour range suggests it is stretched toward the upper end of its recent band, which often invites either a breakout attempt or a brief consolidation as traders reassess whether the move has enough fuel.
Oscillators & Momentum
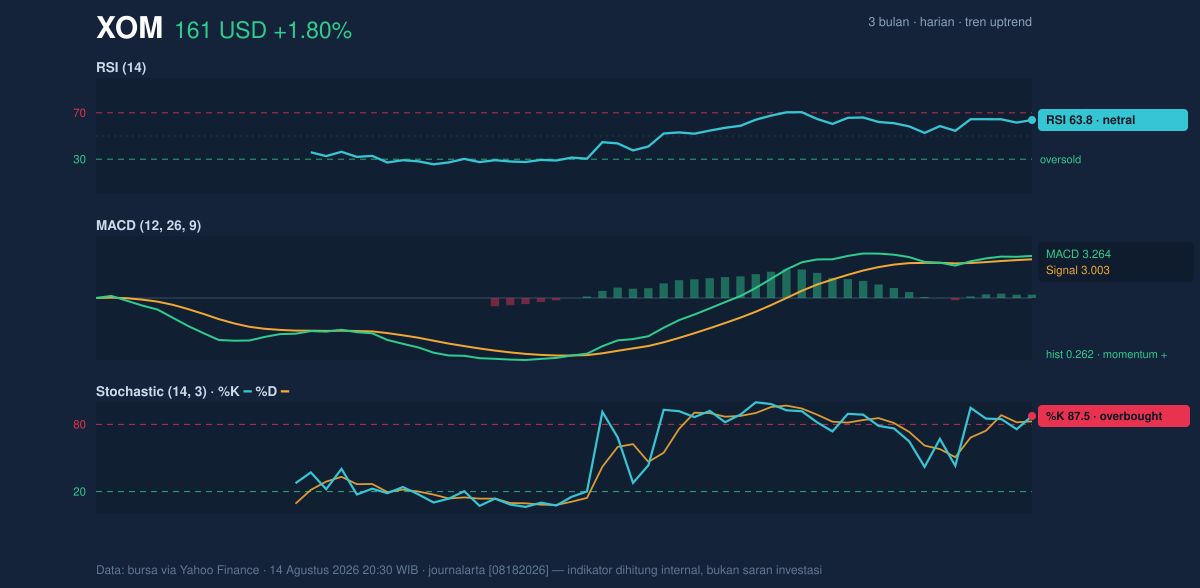
Momentum is supportive, but it is not fully relaxed. The MACD at 3.264 remains above its signal line at 3.003, with a positive histogram of 0.262, which means the stock still has upward momentum rather than a fading trend. In plain English, MACD is telling us the recent price move is still outpacing its own short-term average, a common sign that buyers remain in control.
The caution comes from the faster oscillators. RSI at 63.8 is still technically neutral, not yet in the classic overbought zone, but it is leaning toward the stronger end of the range. More importantly, Stochastic %K at 87.5 and %D at 82.6 are both in overbought territory, as shown in the chart. That usually does not mean an immediate reversal; it means the stock has risen quickly enough that short-term traders may start taking profits unless fresh demand keeps arriving.
Volatility & Volume
The Bollinger setup is one of the more important signals here. XOM is trading near the top band at 161.77, with %B at 98%, which means price is hugging the upper edge of the band rather than sitting in the middle. That often happens during strong advances, but it also means the stock is near an area where a pause is statistically more likely. The 7.9% band width is narrowing, pointing to a squeeze, which often precedes a larger move. In practical terms, the stock is coiling: if buyers keep pushing, the next move can be sharp; if they stall, the stock can snap back toward the middle band at 155.60.
Volume does not yet fully confirm the breakout tone. The latest volume of 10,231,300 is only 0.7× the 20-hour average of 13,952,955, and OBV is falling. OBV, or on-balance volume, tracks whether volume is flowing with price; when it drops while price rises, it can mean the advance is being driven more by price momentum than by broad participation. That does not break the trend, but it does argue for caution near resistance.
Key Levels & Scenarios
The chart leaves a fairly clear map. Immediate support sits at 148.36, while the more relevant near-term pivot is the SMA20 at 155.60, which also matches the Bollinger middle band. If XOM holds above that area, the trend remains intact and the recent move looks like a continuation rather than a spike. If it loses that zone, the stock would likely be testing whether the rally was overextended.
On the upside, the first meaningful barrier is the 160.10 resistance, followed by the 163.68 three-month high. A clean hold above resistance would strengthen the case that the squeeze is resolving upward. Failure to sustain above that line would instead suggest the stock is still trading inside a capped range, even if the longer trend remains positive.
Technical Verdict: HOLD (wait & see)
HOLD (wait & see) — the trend is positive, but the stock is also stretched near the upper Bollinger band and overbought on Stochastic, while volume and OBV are not yet confirming the latest push.
- MACD remains positive, so the trend still has momentum behind it.
- Price is above the SMA20 and SMA50, which keeps the broader structure constructive.
- Stochastic is overbought and volume is below average, so the move is not fully confirmed.
Verdict invalidated if price falls below 155.60, because that would mean XOM has slipped back under the short-term trend line and the Bollinger mid-band.
- Ideal entry range: 155.60 to 160.10
- Exit target: 163.68
- Stop loss protection: 148.36
For non-traders, this means the stock still looks technically healthy, but it is close enough to resistance that the next move could either extend the rally or force a pause.
Summary Data XOM
| Last price | 161.46 USD |
| Change 1 day / 5 days / 1 month | 1.80% / 5.50% / 9.57% |
| Trend / MA-cross | uptrend / none |
| SMA20 / SMA50 | 155.60 / 147.57 |
| RSI (14) / Stochastic %K | 63.8 / 87.5 |
| Bollinger %B / ATR | 98% / 3.96 |
| Support / Resistance 20 days | 148.36 / 160.10 |
| Data as of | 14 Agustus 2026 20:30 WIB |


