Testing Key Resistance, DBS Stock Drops 0.27% Today
On September 25, 2026: price 77.48 SGD, trend uptrend, RSI 56.3, support 76.15, resistance 78.65. technical analysis of dbs stock. Testing Key Resistance —…

DBS Group’s shares slipped to SGD 77.48 on 24 September 2026, down 0.27% from the previous close, but the broader picture still leans constructive: the stock remains above its short- and medium-term moving averages, while the trading range has tightened enough to hint that a larger move may be building. As shown in the chart, this is not a clean breakout setup yet; it is a market pausing inside an established uptrend, with momentum and participation sending mixed signals.
Trend & Price Action
The price sits just above SMA20 at 77.39 and comfortably above SMA50 at 75.85, which keeps the trend structure tilted upward. The fact that the price is above the SMA20 matters because it shows DBS is still trading above the short-term consensus line, even after a modest daily dip. The SMA20 slope of 0.48% over 5 days reinforces that the trend is still rising rather than rolling over. There is no fresh MA-cross, so the current message is continuity, not a new trend signal.
The stock is also positioned in the upper half of its recent range, with price at 53% of the 20-hour band. That is a subtle but useful detail: it suggests the market is not stretched to the top of the range, yet it is not weak enough to imply distribution. The 3-month range adds context. DBS is trading well below the 3-month high of 79.05, but far above the 3-month low of 65.10, which means the market is still working within a recovery trend rather than a full reversal.
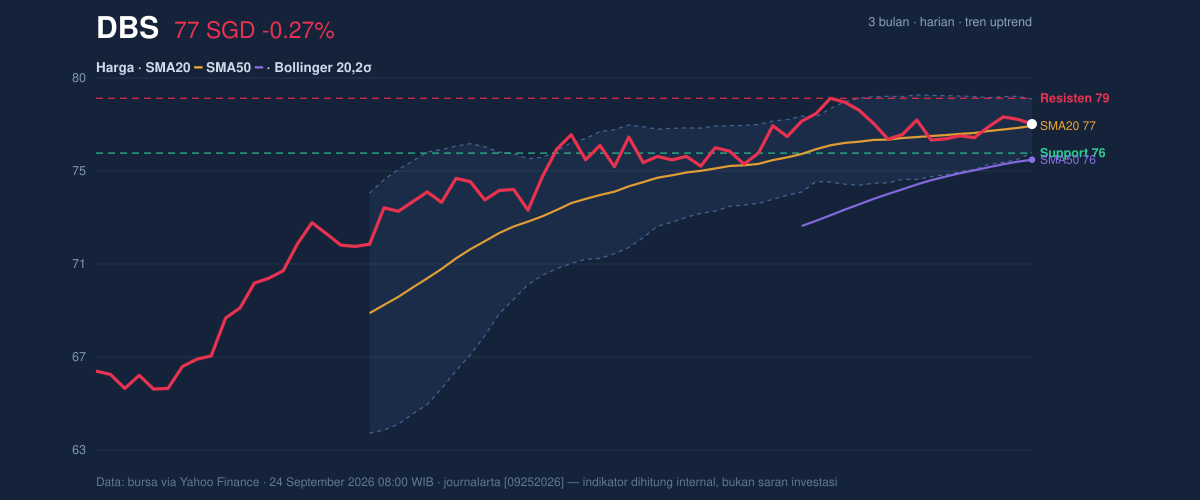
The nearest technical floor is 76.15, while near-term resistance stands at 78.65. That narrow corridor is important because it frames the current debate: whether DBS can keep consolidating above support long enough to challenge the upper edge, or whether fading momentum pulls it back toward the lower band.
Oscillators & Momentum
RSI at 56.3 is neutral-to-positive, which usually means the stock has room to move without being overbought. In plain language, buyers still have some control, but not enough to suggest a strong momentum surge right now. The Stochastic %K at 51.1 and %D at 51.9 are also neutral and tightly clustered, a sign that the short-term rhythm is balanced rather than directional. There is no classic overbought or oversold pressure here, so the oscillators are not screaming for a reversal.
What stands out more is the MACD at 0.506 versus the signal line at 0.631, leaving a -0.125 histogram. That negative histogram means the faster trend has slipped below the slower trend’s pace, a sign of fading near-term momentum even while the broader trend remains up. This is the kind of reading that often appears during consolidation: the trend is intact, but the impulse has cooled.
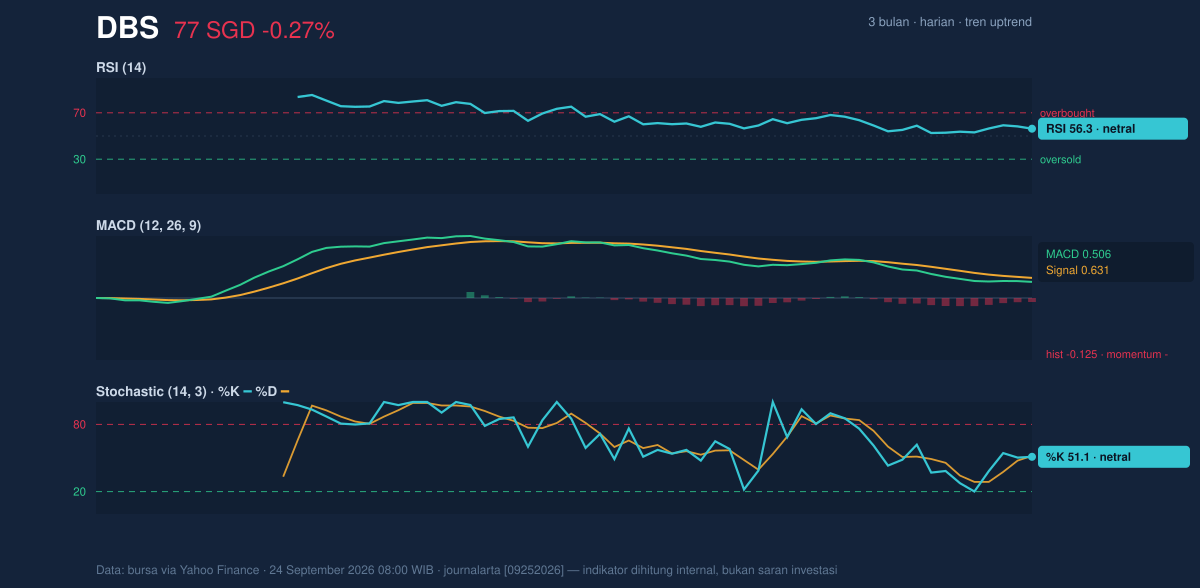
So the momentum picture is not bearish in the larger sense, but it is not fully supportive either. The market is digesting gains rather than accelerating them.
Volatility & Volume
Bollinger Bands are narrowing, with the upper band at 78.62, the middle band at 77.39, and the lower band at 76.17. The 3.2% band width points to a squeeze, which often precedes a sharper move once price escapes the compression zone. The key signal here is not direction by itself, but stored energy: the tighter the band, the more likely the next meaningful move will be larger than the recent daily drift.
At the same time, ATR(14) at 0.84, or 1.1% of price, says realized volatility is low. That matters because a low ATR plus a Bollinger squeeze often means the market is waiting for a catalyst rather than already reacting to one. Volume does not yet confirm urgency: the latest turnover of 3,328,500 is below the 20-hour average of 3,581,288, or 0.9× normal. In other words, the day’s dip arrived on lighter-than-usual participation, which reduces the weight of the selloff.
Still, OBV is rising, and that is the more constructive volume signal. On-balance volume tracks whether money is broadly accumulating or distributing, and a rising OBV suggests that, despite the softer daily tape, buyers have been more active over time than the price alone might imply. That divergence often matters more than a single quiet session.
Key Levels & Scenarios
The chart points to a simple setup: 76.15 is the first support to watch, while 78.65 is the immediate ceiling. If price holds above 76.15 and volume improves, the squeeze could resolve toward the upper band near 78.62 and then the resistance zone at 78.65. If that ceiling gives way, the market would be testing the edge of the recent 3-month range near 79.05.
On the downside, a failure to defend 76.15 would weaken the current uptrend structure and expose the lower Bollinger band at 76.17 as a very near technical test. Because the bands are tight, breaks can be abrupt; when compression ends, price often moves quickly rather than neatly.
Technical Verdict: HOLD (wait & see)
HOLD (wait & see) fits best because the trend is still upward, but momentum has softened and the stock is sitting inside a narrow range rather than breaking out. RSI at 56.3 and Stochastic near 51 are neutral, so they do not confirm a strong directional push. MACD is below its signal line, which warns that short-term momentum is negative even as price stays above SMA20 and SMA50. The Bollinger squeeze also suggests a move is coming, but not yet which way.
- Ideal Entry Range: 76.17 to 77.39
- Exit Target (Target Price): 78.62 to 78.65
- Stop Loss Protection: below 76.15
This view is invalidated if price breaks and holds below 76.15, because that would undermine the current range support and weaken the uptrend structure.
In plain English: DBS is still trending higher, but it is waiting for proof that the next move has real strength behind it.
“The market is compressed, not convinced.”
Summary Data DBS
| Last price | 77.48 SGD |
| Change 1 day / 5 days / 1 month | -0.27% / 0.70% / 2.42% |
| Trend / MA-cross | uptrend / none |
| SMA20 / SMA50 | 77.39 / 75.85 |
| RSI (14) / Stochastic %K | 56.3 / 51.1 |
| Bollinger %B / ATR | 54% / 0.84 |
| Support / Resistance 20 days | 76.15 / 78.65 |
| Data as of | 24 September 2026 08:00 WIB |


