WMT Stock Gains 0.36% Today, Momentum Gains
On September 28, 2026: price 107.98 USD, trend sideways, RSI 49.3, support 103.09, resistance 110.53. technical analysis of wmt stock. WMT Stock Gains — full…

Walmart is holding a narrow technical lead in a market that is still undecided, with the shares at 107.98 USD and sitting just above the short-term average while the longer trend remains a little heavier. The message from the chart is not that momentum has taken off, but that the stock is trying to stabilize inside a compressed range, and that matters because compressed ranges often precede a larger move once one side finally gives way.
Trend & Price Action
As shown in the chart, Walmart is trading above SMA20 at 107.11 but still below SMA50 at 109.38, which is the textbook shape of a stock that has short-term support but has not yet repaired the medium-term trend. That gap between the two averages is important: it suggests buyers have been able to defend recent weakness, yet they have not fully reclaimed the earlier trend line that would normally signal a stronger recovery.
The broader pattern is described as sideways, and the slope of SMA20 is only 1.00% over 5 days, so the market is not showing the kind of decisive upward angle that usually accompanies a sustained breakout. Price is also positioned around 66% of the 20-hour range, which means it is closer to the upper half of the recent band than the lower half, but not near enough to resistance to claim a clean trend extension.
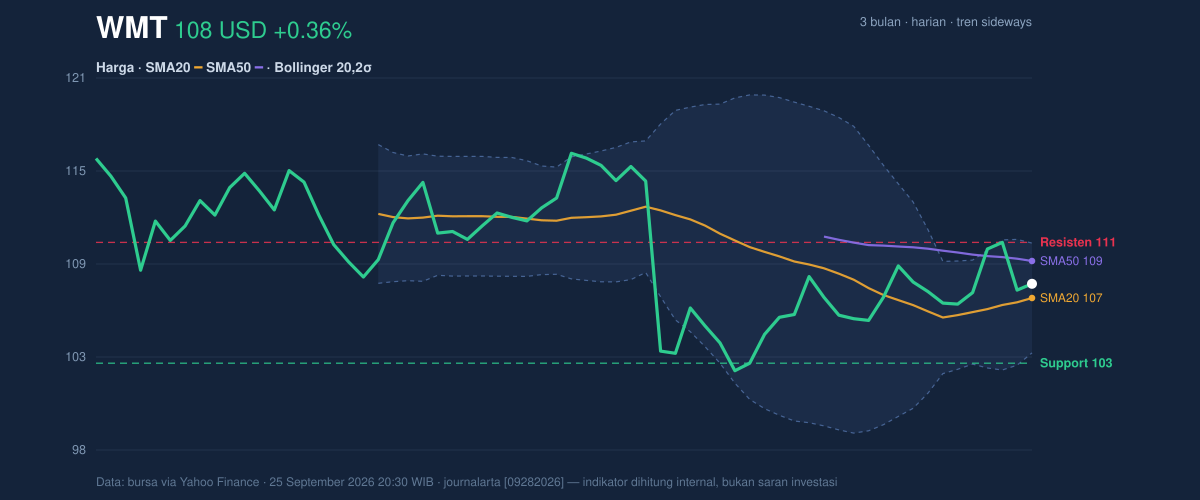
The immediate map is clear. Support at 103.09 has become the floor to watch, while resistance at 110.53 is the first barrier that would need to be cleared before the price can challenge the broader ceiling near the upper Bollinger band. The stock’s 3-month low of 102.15 sits just under that support zone, which gives that area added significance: if it fails, the chart loses its recent stabilization pattern.
Oscillators & Momentum
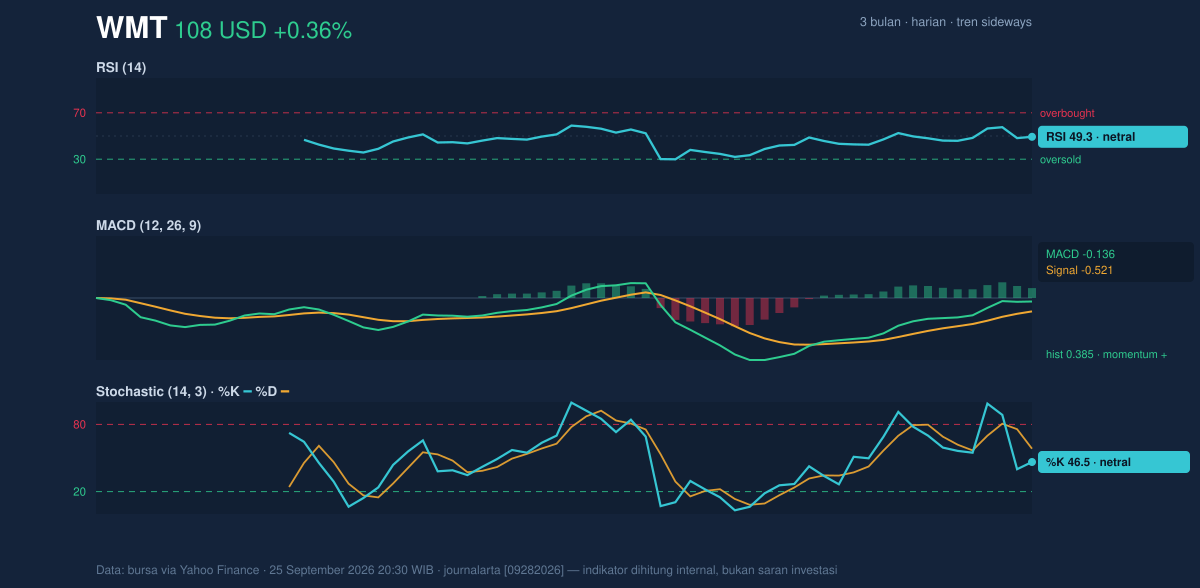
Momentum is mixed rather than directional. The RSI at 49.3 is neutral, which means the stock is neither stretched into overbought territory nor washed out into oversold conditions. In plain terms, the market is waiting for a catalyst, and the oscillator is reflecting that hesitation rather than leading it.
The stochastic reading is also neutral, with %K at 46.5 and %D at 58.3. That setup matters because %K below %D often shows short-term momentum lagging a bit, but here the gap is not severe enough to imply a full reversal. It is more consistent with a stock that has paused after a modest bounce and is still searching for direction.
The more constructive signal comes from MACD. The line is -0.136, still below zero, but above the signal line at -0.521, and the histogram is 0.385. That combination usually means downside momentum has eased and the stock is no longer falling as forcefully as before. It is not a full bullish breakout signal, but it does say the tape is improving beneath the surface.
Volatility & Volume
Volatility is contained but not dead. The Bollinger band width is 6.3%, and the bands are described as narrowing, which often signals a squeeze. A squeeze does not predict direction on its own; it simply tells traders that the range is tightening and the next move could be more abrupt than recent daily changes suggest. Price is sitting at %B 63%, which places it above the midpoint of the band and closer to the upper half, but still below the upper band at 110.49.
That is a useful detail because it shows the stock has room to rise before it becomes technically stretched. At the same time, the ATR of 1.82 — about 1.7% of price — indicates only moderate day-to-day movement. So while the setup is compressed, the stock is not currently behaving like a highly volatile name; it is more of a slow-building setup than a fast-moving one.
Volume is less supportive. The latest print of 19,614,100 is below the 20-day average of 22,705,685, or about 0.9× normal. That means the recent lift in price has not yet been backed by stronger participation. The OBV is falling, which is a caution flag: on-balance volume tracks whether money flow is accumulating or distributing, and a decline here suggests buyers have not fully taken control even as the share price has steadied.
Key Levels & Scenarios
The near-term structure is straightforward. A push through 110.53 resistance would put the stock into the upper Bollinger zone and increase the odds that the squeeze resolves upward. If that move happens with better volume, the chart would begin to look less like a range and more like a recovery attempt.
If instead the shares slip back below 107.11, the middle Bollinger line and SMA20, then the recent bounce starts to lose credibility. A break of 103.09 support would be more serious, because it would expose the area near the 3-month low of 102.15 and signal that the sideways pattern is giving way to renewed weakness.
Technical Verdict: HOLD (wait & see)
HOLD (wait & see) fits the chart best because the stock is above short-term support but still below the medium-term average, with momentum improving only modestly.
- Reason 1: MACD is positive on the histogram, which hints that downside pressure is fading.
- Reason 2: RSI at 49.3 and stochastic readings are neutral, so there is no strong overextension either way.
- Reason 3: Bollinger bands are squeezing, which often precedes a larger move, but direction is not confirmed.
- Verdict invalidated if price breaks below 103.09, because that would weaken the current support structure and reopen the path toward the 102.15 low.
- Ideal Entry Range: 107.11 to 107.98, where price is holding the SMA20 and the Bollinger midline.
- Exit Target: 110.49 to 110.53, aligned with the upper Bollinger band and nearby resistance.
- Stop Loss protection: below 103.09, with the 102.15 low as the deeper warning line.
For non-traders, this means Walmart is not flashing a strong directional signal yet, but it is sitting in a tight zone where the next move could matter more than the last few quiet sessions.
Summary Data WMT
| Last price | 107.98 USD |
| Change 1 day / 5 days / 1 month | 0.36% / 1.17% / 5.21% |
| Trend / MA-cross | sideways / none |
| SMA20 / SMA50 | 107.11 / 109.38 |
| RSI (14) / Stochastic %K | 49.3 / 46.5 |
| Bollinger %B / ATR | 63% / 1.82 |
| Support / Resistance 20 days | 103.09 / 110.53 |
| Data as of | 25 September 2026 20:30 WIB |

