GSK Share Price Rises 0.00%, Golden Cross Formed In Focus
On November 5, 2026: price 1,890.00 GBp, trend uptrend, RSI 55.6, support 1,750.00, resistance 1,923.50. technical analysis of gsk stock.
By matthew jonathan
November 6, 20264 min read
Logo GSK plc — JournalArta illustration
Why GSK is in focus today
Fresh golden cross: SMA20 crossed above SMA50
Uptrend confirmed (5-day change 4.19%)
Selected automatically from 98 LSE (UK) stocks by a technical-signal score with daily weighted randomisation — not a recommendation.
GSK closed Thursday, November 5, at 1,890.00 GBp, unchanged on the session, as exchange data showed a golden cross forming one session earlier and the share’s five-day gain reaching 4.19%. That combination puts the pharmaceutical group on the market’s watch list: its short-term trend has strengthened, though trading participation remains subdued.
The move is measured, not a breakout. GSK’s shares gained 8.90% over one month and stand above both the 20-day and 50-day moving averages, while the latest close was still below the 20-day resistance at 1,923.50 GBp. The signal is constructive, but price has yet to clear a nearby hurdle.
Trend & Price Action
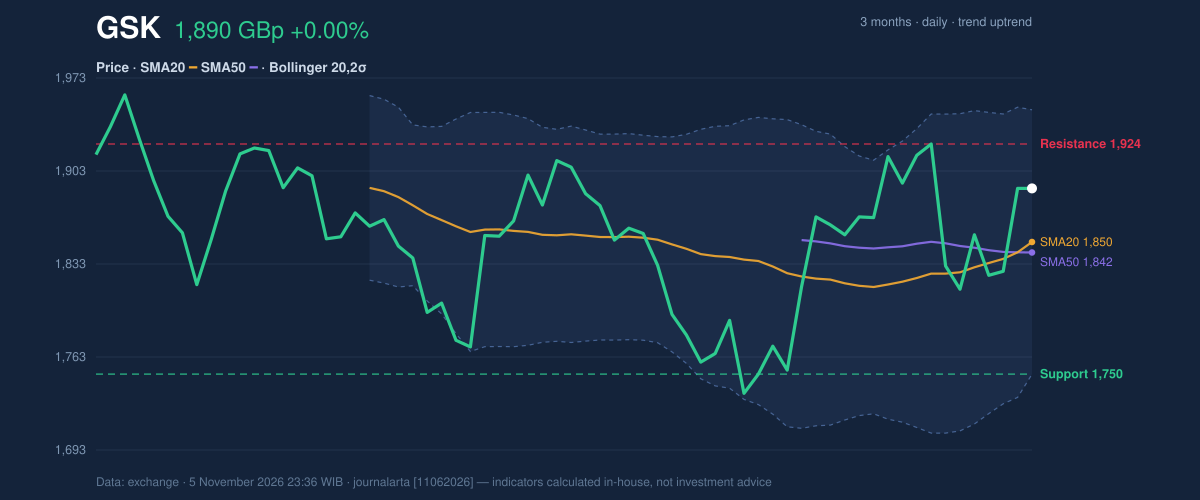
The 20-day average, at 1,849.58 GBp, crossed above the 50-day average, at 1,841.64 GBp, one session before the latest session. Known as a golden cross, this pattern suggests recent prices have gained strength relative to the medium-term trend; it is a lagging signal, not proof that gains will continue. The 20-day average rose 1.25% over five days, supporting the picture of an upward trend.
At 1,890.00 GBp, the share sits above both averages and at 81% of its 20-day range, closer to resistance than support. The three-month high of 2,158.00 GBp remains well above the current price, while the three-month low is 1,735.50 GBp. This longer range matters: the latest advance is positive, but does not erase the distance to the prior high.
The chart shows price holding above the moving averages, with resistance at 1,923.50 GBp and the Bollinger bands defining a broader near-term range.
3-month price action chart of GSK: price, SMA20/50, Bollinger, support & resistance.
Advertisement
Oscillators & Momentum
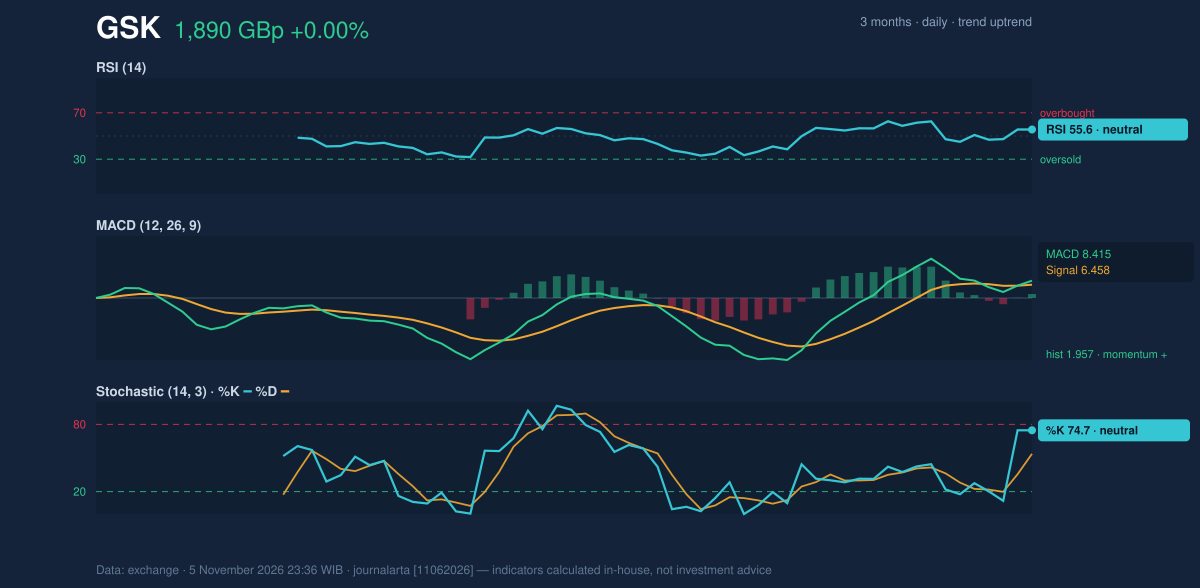
Momentum indicators broadly support the rising trend without showing extreme conditions. RSI is 55.6, a neutral reading: it indicates moderate upward momentum, rather than a market commonly described as overbought or oversold. The Stochastic oscillator is also neutral, with %K at 74.7 and %D at 53.7; the gap suggests short-term strength, but the reading alone does not confirm a durable breakout.
MACD offers a firmer signal. Its histogram is positive at 1.957, with MACD at 8.415 above its 6.458 signal line. That means the faster measure of price momentum is above its comparison line, consistent with a strengthening trend. The technical screen also identifies the histogram as having just turned positive, adding confirmation—but not removing the need for price to clear resistance.
The chart places these signals together: RSI and Stochastic remain neutral, while MACD is positive.
Momentum chart of GSK: RSI(14), MACD, Stochastic.
Volatility, Volume & Key Levels
Bollinger bands—an indicator that widens or narrows with price volatility—show GSK at 70% of the distance between the lower band at 1,749.90 GBp and the upper band at 1,949.25 GBp. The band width is 10.8%, classified as normal, so the data do not point to an unusually tight market poised for a large move. The share is in the upper half of the band, but has room before reaching its upper edge.
Average true range, a measure of typical price movement, is 46.87 GBp, or 2.5% of the share price, indicating moderate volatility. Volume provides a caution: the latest 5,323,713 shares were about 0.7 times the 20-day average of 7,721,375, while on-balance volume was falling. In plain terms, the price rise has not been accompanied by stronger-than-usual trading, so participation is not yet confirming the move.
The immediate test is resistance at 1,923.50 GBp. A move above it would put the three-month high of 2,158.00 GBp in focus as the next major reference level. On a setback, the 20-day average at 1,849.58 GBp is a nearer trend marker; the stated 20-day support is 1,750.00 GBp. A fall below that support would undermine the current technical setup.
Advertisement
Technical Verdict: BUY
The technical bias is bullish, with three bullish signals and no bearish signals in the supplied screen. The strongest supports are the golden cross formed one session before the latest session, the positive MACD histogram, and the price holding above the 50-day average within an uptrend. Weak volume and falling OBV temper the confirmation, but do not overturn the stated bias.
- Ideal Entry Range: 1,849.58–1,890.00 GBp, using the 20-day average and latest price as reference points.
- Exit Target (Target Price): 1,923.50 GBp, the next 20-day resistance.
- Stop Loss: 1,750.00 GBp, the 20-day support.
- Invalidation: The verdict is invalidated if price falls below 1,750.00 GBp.
In plain English, the chart leans upward, but the next test is whether GSK can clear resistance with stronger trading activity.
Indicator
Reading
Last price
1,890.00 GBp
Change
1 day: 0.00% | 5 days: 4.19% | 1 month: 8.90%
SMA20 / SMA50
1,849.58 / 1,841.64 GBp
RSI / Stochastic
55.6 / %K 74.7, %D 53.7
MACD / signal / histogram
8.415 / 6.458 / 1.957
Volume / 20-day average
5,323,713 / 7,721,375
20-day support / resistance
1,750.00 / 1,923.50 GBp
Three-month low / high
1,735.50 / 2,158.00 GBp
Advertisement
Summary Data GSK
Last price
1,890.00 GBp
Change 1 day / 5 days / 1 month
0.00% / 4.19% / 8.90%
Trend / MA-cross
uptrend / golden
SMA20 / SMA50
1,849.58 / 1,841.64
RSI (14) / Stochastic %K
55.6 / 74.7
Bollinger %B / ATR
70% / 46.87
Support / Resistance 20 days
1,750.00 / 1,923.50
Data as of
5 November 2026 23:36 WIB
Disclaimer: This technical analysis is generated automatically from exchange data and indicators calculated by JournalArta, for information and education only. The verdict and the entry, target and stop-loss levels are not investment advice or a solicitation to buy or sell any security. Investment decisions and their risks rest solely with the reader.