RELX Share Price on Thursday: Rises 0.85%, RSI Overbought
On November 5, 2026: price 3,084.00 GBp, trend uptrend, RSI 70.1, support 2,720.00, resistance 3,084.00. technical analysis of relx stock.
By matthew jonathan
November 6, 20264 min read
Logo RELX plc — JournalArta illustration
Why RELX is in focus today
Closed at a 20-day high (3,084.00)
Trading near its 3-month high (3,129.00)
RSI(14) at 70.1 — overbought zone
MACD histogram has just turned positive
Uptrend confirmed (5-day change 5.80%)
Selected automatically from 98 LSE (UK) stocks by a technical-signal score with daily weighted randomisation — not a recommendation.
RELX plc closed at 3,084.00 GBp on the London Stock Exchange on Thursday, November 5, 2026, reaching its highest level in the past 20 trading days and ending at the top of that period’s range. The move puts the information and analytics group close to its three-month high, but stretched momentum and subdued trading volume complicate the breakout signal.
The share gained 0.85% on the session, 5.80% over five days and 18.84% over one month, according to the supplied market data. That is a strong advance. But a neutral technical bias means the price strength has not yet been matched by enough indicators to establish a broader bullish confirmation.
Advertisement
Trend & Price Action
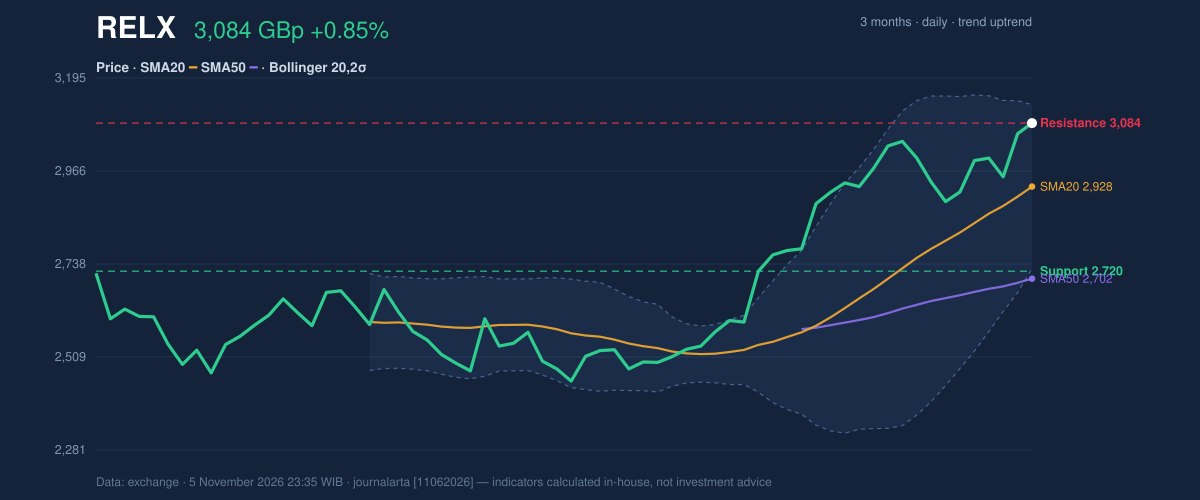
RELX is trading above its 20-day simple moving average (SMA), at 2,927.90 GBp, and its 50-day SMA, at 2,701.54 GBp. A share price above both averages generally indicates that recent and medium-term price trends are rising. The 20-day average itself rose 4.01% over five days, reinforcing that direction. No new moving-average crossover was recorded, however, so the latest session did not produce a fresh signal from the relationship between the averages.
The close at 3,084.00 GBp is also the 20-day resistance level, placing the price at the top of its recent trading range. The three-month high, 3,129.00 GBp, is just above it. A sustained move through that high would extend the advance; failure to hold the current area could leave the share vulnerable to a pullback toward its moving averages or the 20-day support at 2,720.00 GBp.
As shown in the chart, the price is near the upper Bollinger Band at 3,129.54 GBp. Bollinger Bands plot a moving average with upper and lower boundaries based on price variability; the share’s position near the upper boundary shows strong recent demand, but also leaves less room before the price reaches that statistical edge. The band width is 13.8%, described as normal, rather than unusually narrow or expanding.
3-month price action chart of RELX: price, SMA20/50, Bollinger, support & resistance.
Advertisement
Oscillators & Momentum
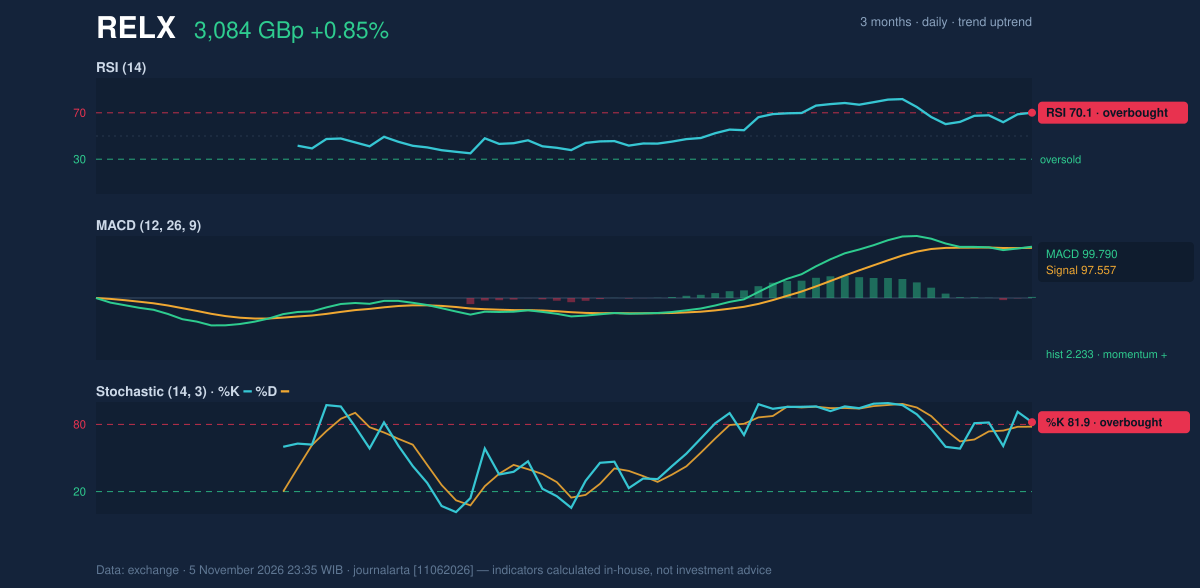
Momentum indicators confirm the rally but also warn that it has become crowded. The RSI is 70.1, in overbought territory. RSI measures the pace of recent gains and losses; a reading above 70 can indicate that buying has run ahead of its usual rhythm, though it does not by itself establish that a reversal is under way. The Stochastic %K at 81.9 and %D at 77.9 are also overbought, offering a similar caution.
The MACD presents a more constructive signal: its histogram has turned positive at 2.233, with the MACD at 99.790 above its 97.557 signal line. The histogram reflects the gap between those lines, so a positive reading indicates improving short-term momentum. It has only just turned positive, however, and is not yet strong enough to outweigh the overbought readings in the overall technical assessment.
Momentum chart of RELX: RSI(14), MACD, Stochastic.
Volatility, Volume & Key Levels
Trading volume was 3,176,333 shares, or 0.8 times the 20-day average of 4,001,613. The price rise therefore came on lighter-than-usual participation, a reason to be cautious about treating the close at resistance as a decisive breakout. On the other hand, on-balance volume (OBV), which tracks buying and selling pressure through volume, is rising. That supports the direction of the trend, though it does not erase the thin-volume signal.
The 14-day average true range (ATR), a measure of typical price movement, is 82.83 GBp, or 2.7% of the share price, indicating moderate volatility. The key near-term test is the space between the 20-day resistance at 3,084.00 GBp and the three-month high at 3,129.00 GBp. A clear hold above the three-month high would strengthen the breakout case. Rejection in that zone would put 2,959.75 GBp—the price minus 1.5 times ATR—in view as a volatility-based reference, with 2,720.00 GBp marking 20-day support.
Advertisement
Technical Verdict: HOLD (wait & see)
The verdict follows the neutral technical bias. Price is above both moving averages and OBV is rising, while the MACD histogram has turned positive; against that, RSI and Stochastic are overbought, and volume is below its 20-day average. That mix supports monitoring the resistance test rather than treating the rally as fully confirmed. The central signal is a rising trend meeting overbought momentum at resistance.
Entry range: 2,927.90–3,084.00 GBp, bounded by the 20-day average and 20-day resistance.
Exit target: 3,129.00 GBp, the three-month high.
Stop-loss reference: 2,720.00 GBp, the 20-day support.
The verdict is invalidated if the price falls below 2,720.00 GBp. In plain English, the indicators show a strong but stretched share price that has yet to clear its nearby high decisively.
The 20-day support is 2,720.00 GBp.
Summary Data RELX
Last price
3,084.00 GBp
Change 1 day / 5 days / 1 month
0.85% / 5.80% / 18.84%
Trend / MA-cross
uptrend / none
SMA20 / SMA50
2,927.90 / 2,701.54
RSI (14) / Stochastic %K
70.1 / 81.9
Bollinger %B / ATR
89% / 82.83
Support / Resistance 20 days
2,720.00 / 3,084.00
Data as of
5 November 2026 23:35 WIB
Disclaimer: This technical analysis is generated automatically from exchange data and indicators calculated by JournalArta, for information and education only. The verdict and the entry, target and stop-loss levels are not investment advice or a solicitation to buy or sell any security. Investment decisions and their risks rest solely with the reader.