British American Tobacco Share Price on Thursday: Rises 1.57%, RSI Overbought
On November 5, 2026: price 4,717.00 GBp, trend uptrend, RSI 73.3, support 4,194.00, resistance 4,717.00. technical analysis of bat stock.
By matthew jonathan
November 6, 20264 min read
Logo British American Tobacco — JournalArta illustration
Why BAT is in focus today
Closed at a 20-day high (4,717.00)
Trading near its 3-month high (4,767.00)
RSI(14) at 73.3 — overbought zone
Uptrend confirmed (5-day change 4.45%)
Selected automatically from 98 LSE (UK) stocks by a technical-signal score with daily weighted randomisation — not a recommendation.
British American Tobacco closed at 4,717.00 GBp on Thursday, November 5, its highest level in the past 20 trading days, with the shares up 4.45% over five days. The move puts the price close to its three-month peak, but also leaves momentum gauges in overbought territory. That tension is the central signal: buyers remain in control, while the risk of a pause has increased.
The shares rose 1.57% in the session and are up 13.36% over one month, according to the supplied market data. Trading volume was about 1.5 times its 20-day average, and On-Balance Volume (OBV), an indicator that tracks whether trading volume is accompanying price moves, was rising. That supports the advance with evidence of participation rather than price movement alone.
Advertisement
Trend & Price Action
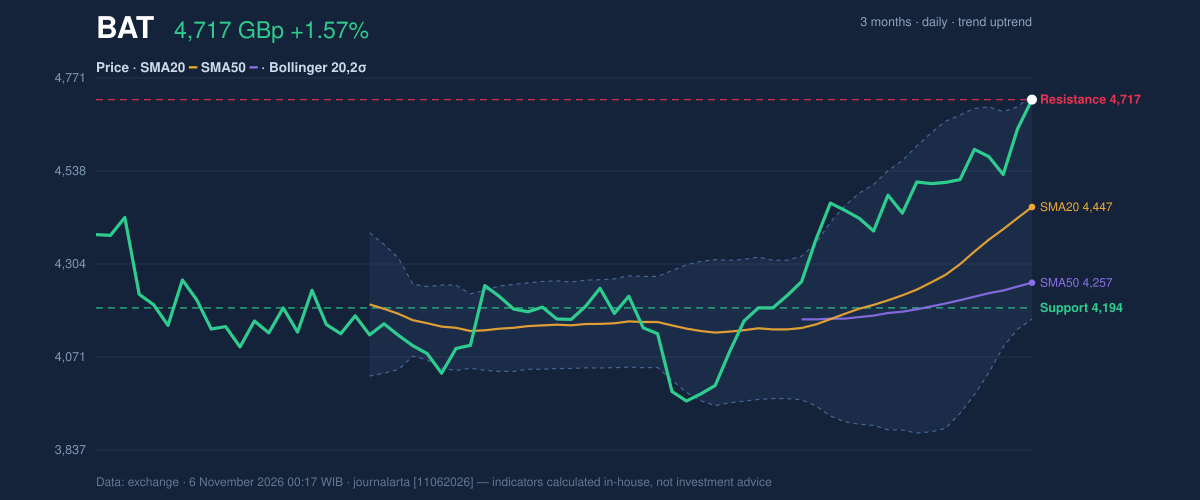
BAT’s price is above both its 20-day simple moving average of 4,447.35 and its 50-day average of 4,257.30. The 20-day average rose 3.34% over five days, indicating that the recent upward trend has been strengthening. No new moving-average crossover has formed, so the trend’s confirmation comes from the price’s position above both averages—not a fresh crossover signal.
The stock sits at the top of its 20-day trading range, with resistance at 4,717.00, and is approaching the three-month high of 4,767.00. This makes the next move important: a sustained break above the three-month peak would extend the advance, while failure to hold near resistance could bring the price back toward its averages. The chart shows the price alongside the moving averages, Bollinger Bands and key levels.
3-month price action chart of BAT: price, SMA20/50, Bollinger, support & resistance.
Oscillators & Momentum
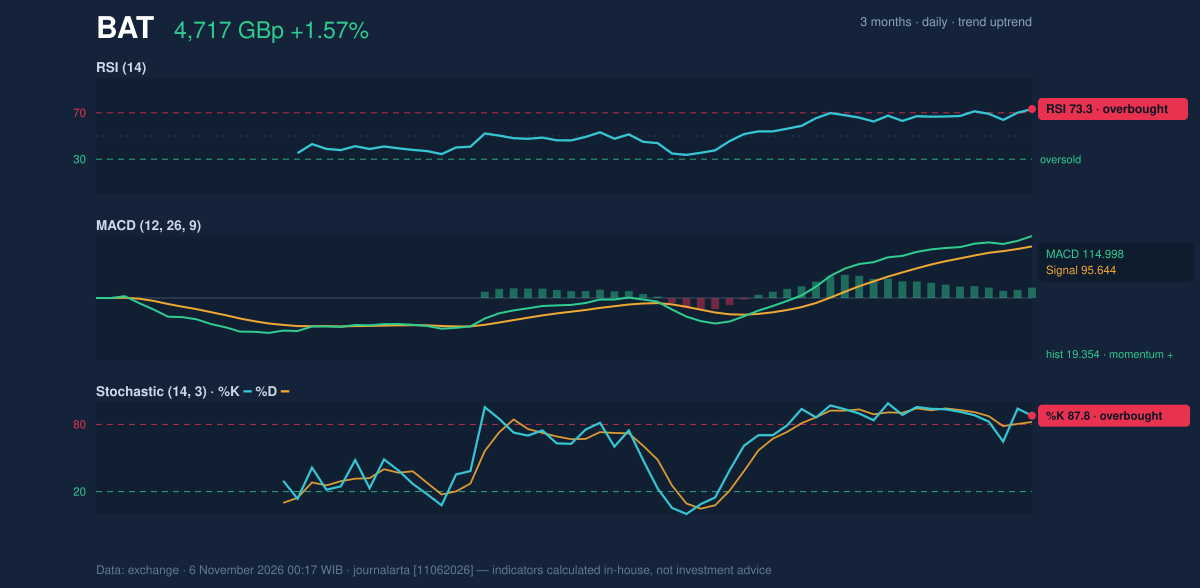
Momentum indicators confirm the recent strength but also warn that the climb may be stretched. The 14-day Relative Strength Index (RSI), which measures the pace of recent gains and losses, is 73.3, in overbought territory. The Stochastic readings are also overbought, with %K at 87.8 and %D at 82.2. These readings do not, by themselves, prove a reversal; in a strong trend, overbought conditions can persist. They do mean, however, that fresh gains may be more vulnerable to a pullback.
The Moving Average Convergence Divergence (MACD) remains positive: 114.998, above its 95.644 signal line, with a positive 19.354 histogram. In plain terms, the trend-following indicator still points to upward momentum. The contrast between a positive MACD and overbought RSI and Stochastic suggests strength with growing short-term heat, rather than a clear bearish reversal. The momentum chart displays RSI, MACD and Stochastic together.
Momentum chart of BAT: RSI(14), MACD, Stochastic.
Advertisement
Volatility, Volume & Key Levels
The share price is near the upper Bollinger Band at 4,728.83, with %B at 98%. Bollinger Bands show how far a price has moved within a range based on recent volatility; a reading near the upper band signals that the price is pressing against the top of that range, not that a reversal is certain. The band width is 12.7%, classified as normal, while the Average True Range (ATR) is 90.46, or 1.9% of the share price, indicating moderate day-to-day volatility.
The reference levels frame the risk around the current price. Resistance is 4,717.00, the three-month high is 4,767.00, and the 20-day support is 4,194.00. A break above 4,767.00 would clear the recent three-month peak; failure to sustain the advance could instead shift attention to support. The three-month low is 3,947.00, while price minus 1.5 times ATR is 4,581.31—an additional volatility-based reference, not a guarantee of where the stock will trade.
Technical Verdict: HOLD
The technical bias is NEUTRAL, so the verdict is HOLD (wait & see). The advance has support from a rising trend, price above both moving averages, and rising OBV. But RSI at 73.3, Stochastic readings of 87.8 and 82.2, and the price near the upper Bollinger Band argue against treating the strong momentum as an unqualified continuation signal. A sustained move through the three-month high would improve the breakout case; failure to hold would weaken it.
- Ideal entry range: 4,447.35–4,581.31, anchored to the 20-day average and the price-minus-1.5×ATR reference.
- Exit target: 4,767.00, the three-month high and next resistance beyond the current 20-day ceiling.
- Stop-loss protection: 4,194.00, the 20-day support; a fall below that level invalidates this verdict’s constructive trend reading.
For non-traders, HOLD means the chart shows an intact uptrend, but stretched momentum leaves the next move uncertain.
Advertisement
Summary Data BAT
Last price
4,717.00 GBp
Change 1 day / 5 days / 1 month
1.57% / 4.45% / 13.36%
Trend / MA-cross
uptrend / none
SMA20 / SMA50
4,447.35 / 4,257.30
RSI (14) / Stochastic %K
73.3 / 87.8
Bollinger %B / ATR
98% / 90.46
Support / Resistance 20 days
4,194.00 / 4,717.00
Data as of
6 November 2026 00:17 WIB
Disclaimer: This technical analysis is generated automatically from exchange data and indicators calculated by JournalArta, for information and education only. The verdict and the entry, target and stop-loss levels are not investment advice or a solicitation to buy or sell any security. Investment decisions and their risks rest solely with the reader.