Unilever Share Price Rises 1.24% (November 5, 2026): Testing Key Resistance
On November 5, 2026: price 5,032.00 GBp, trend uptrend, RSI 63.5, support 4,673.50, resistance 5,032.00. technical analysis of unilever stock.
Why Unilever is in focus today
- Closed at a 20-day high (5,032.00)
- Trading near its 3-month high (5,109.00)
- Uptrend confirmed (5-day change 5.46%)
Selected automatically from 98 LSE (UK) stocks by a technical-signal score with daily weighted randomisation — not a recommendation.
Trend & Price Action
The share finished at its 20-day resistance, placing it at the top of its recent trading range. It is also approaching the three-month high. That proximity matters: a close above resistance could indicate the advance is extending, while failure to move through it would leave the price pressing against a ceiling rather than establishing a clear breakout. Unilever is trading above its 20-day moving average of 4,869.18 GBp and its 50-day average of 4,738.60 GBp. The 20-day average rose 1.91% over five days, evidence that the shorter-term trend is strengthening. There has been no new moving-average crossover, however, so the current structure reflects an existing uptrend rather than a newly confirmed shift in trend. The Bollinger bands are narrowing, a squeeze that can precede a larger move but does not indicate its direction. With the price at 94% of the band range and close to the upper band at 5,054.38 GBp, the share has limited room before testing that boundary. The lower band stands at 4,683.97 GBp.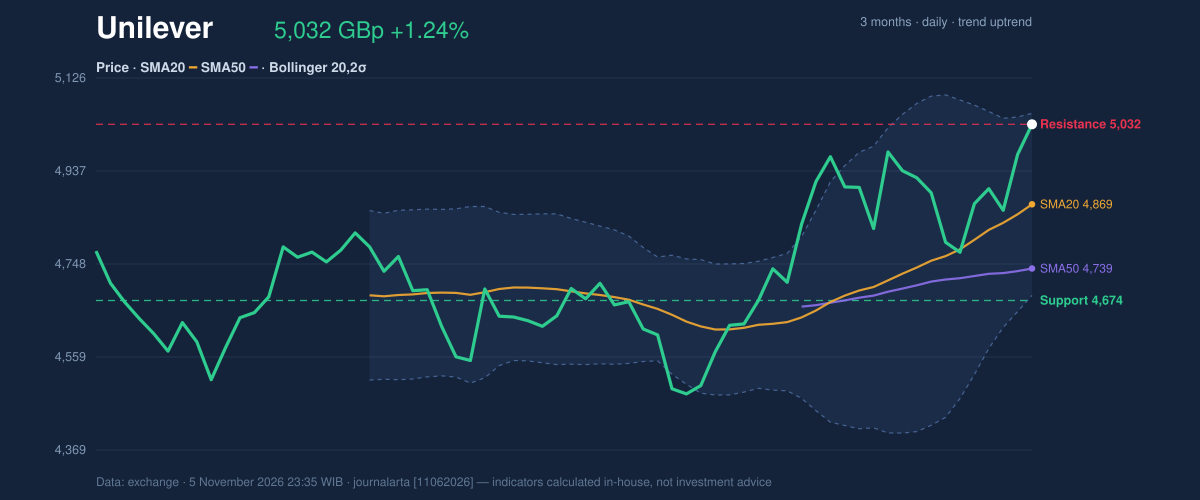
Oscillators & Momentum
Momentum indicators are positive but not uniformly reassuring. The MACD is above its signal line, with a positive histogram of 7.242, indicating upward momentum. RSI at 63.5 remains neutral, rather than showing an extreme reading, while the Stochastic’s %K of 81.1 and %D of 72.0 are in overbought territory. That combination suggests the advance has momentum, but may be vulnerable to a pause or pullback. The technical-bias calculation is neutral, with two of seven bullish signals and none of seven bearish signals. The two positive signals are the MACD histogram turning positive and the potential for a pullback to the 20-day average within an uptrend while price remains above the 50-day average. Neutral here does not mean the trend has turned down; it means the indicators do not yet make a stronger directional case.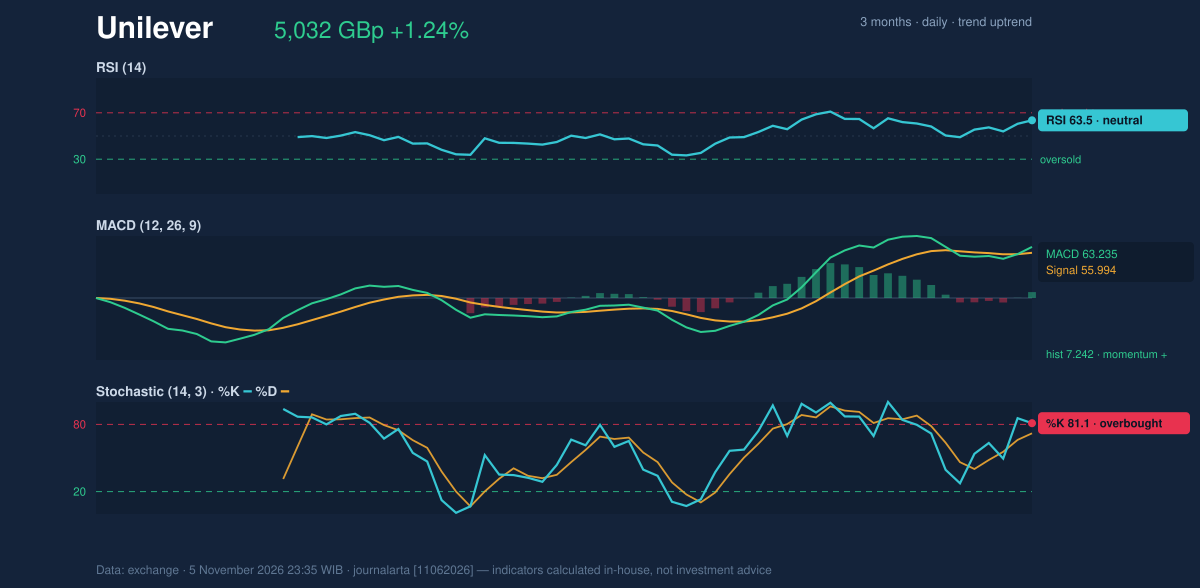
Volatility, Volume & Key Levels
Volume reached 4,190,358 shares, about 1.2 times its 20-day average of 3,494,286. That above-normal activity lends some weight to the session’s move. Yet on-balance volume, which tracks whether trading volume is accumulating on rising days or distributing on falling days, is declining. This divergence tempers the price signal: participation was elevated, but the broader volume trend does not confirm sustained accumulation. Average true range is 124.51 GBp, or 2.5% of the share price, pointing to moderate volatility. The key near-term test is resistance at 5,032.00 GBp, with the three-month high at 5,109.00 GBp as the next reference. A sustained move through those levels would strengthen the breakout case; failure to hold gains could bring the 20-day support at 4,673.50 GBp into focus. The 20-day average at 4,869.18 GBp is another reference point for a pullback that remains consistent with the uptrend.Technical Verdict: HOLD
HOLD (wait & see) fits the neutral technical bias. The rising 20-day average and positive MACD support the trend, but the overbought Stochastic and declining OBV leave the near-term move without full confirmation. The price is also testing its 20-day resistance, while the narrowing Bollinger bands signal the potential for a larger move without specifying its direction. - Ideal entry range: 4,869.18–4,673.50 GBp, between the 20-day average and 20-day support. - Exit target: 5,109.00 GBp, the three-month high beyond the current 20-day resistance. - Stop-loss protection: 4,673.50 GBp, the 20-day support. - Invalidation condition: The HOLD view is invalidated if price falls below 4,673.50 GBp. In plain English, the trend is rising, but resistance and mixed volume signals leave the next move unconfirmed. Technical analysis is not an investment recommendation.Summary Data Unilever
| Last price | 5,032.00 GBp |
| Change 1 day / 5 days / 1 month | 1.24% / 5.46% / 8.78% |
| Trend / MA-cross | uptrend / none |
| SMA20 / SMA50 | 4,869.18 / 4,738.60 |
| RSI (14) / Stochastic %K | 63.5 / 81.1 |
| Bollinger %B / ATR | 94% / 124.51 |
| Support / Resistance 20 days | 4,673.50 / 5,032.00 |
| Data as of | 5 November 2026 23:35 WIB |
Disclaimer: This technical analysis is generated automatically from exchange data and indicators calculated by JournalArta, for information and education only. The verdict and the entry, target and stop-loss levels are not investment advice or a solicitation to buy or sell any security. Investment decisions and their risks rest solely with the reader.
Track Unilever share price daily: live levels, support/resistance and our full Unilever analysis history.