Entain Share Price Little Changed on Friday, Up 7.1% in a Month
Technical analysis of Entain stock on November 13, 2026: price 475.40 GBp, trend uptrend, RSI 54.8, support 435.10, resistance 497.70.

Entain plc, the London-listed betting and gaming group, closed Friday, November 13, 2026 at 475.40 GBp, essentially flat on the day but with a chart pattern that has just turned constructive: the 20-day average has crossed above the 50-day average, and a month of gains sits underneath it.
Why Entain is in focus today
Selected automatically from 7 LSE (UK) stocks by a technical-signal score with daily weighted randomisation — not a recommendation.
The stock slipped 0.04% on the day (previous close 475.60), but it is up 0.98% over five days and 7.14% over one month. A quiet day inside a rising trend is the setup worth examining, because it shows whether buyers are still in control when nothing dramatic is happening.
Trend & Price Action
The trend reads as an uptrend. Price sits above both the 20-day average (SMA20) at 465.85 and the 50-day average (SMA50) at 460.59. The 20-day average rose 1.84% over five days, which says recent closes have been consistently higher than those of a month ago. It does not measure the share price's own gain.
The sharper signal is the golden cross: the SMA20 crossed above the SMA50 one session before the latest session. A golden cross is a lagging signal. It confirms that the short-term average has overtaken the longer one, rather than predicting the next move. Its value here is that it agrees with price position and slope instead of contradicting them.
As shown in the chart below, the stock has pulled back toward the SMA20 inside this uptrend. A dip to the average, while price stays above the SMA50, is the kind of retest that trend followers watch for.
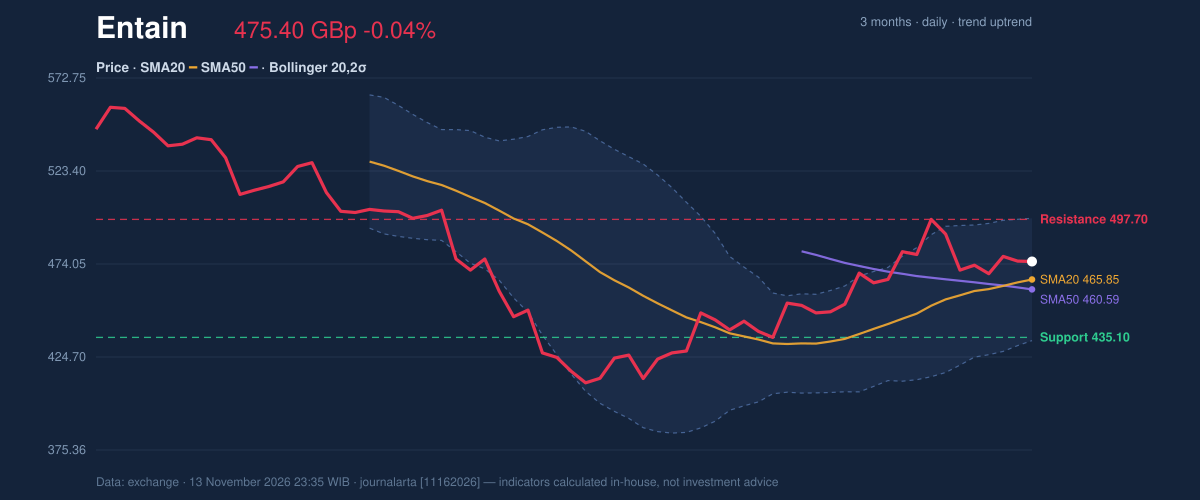
The wider picture adds a caution. The three-month high is 578.00 and the low is 405.41, so the stock is still well below its recent peak even after the monthly rally. The recovery is real, but much of the earlier ground has not been regained.
Oscillators & Momentum
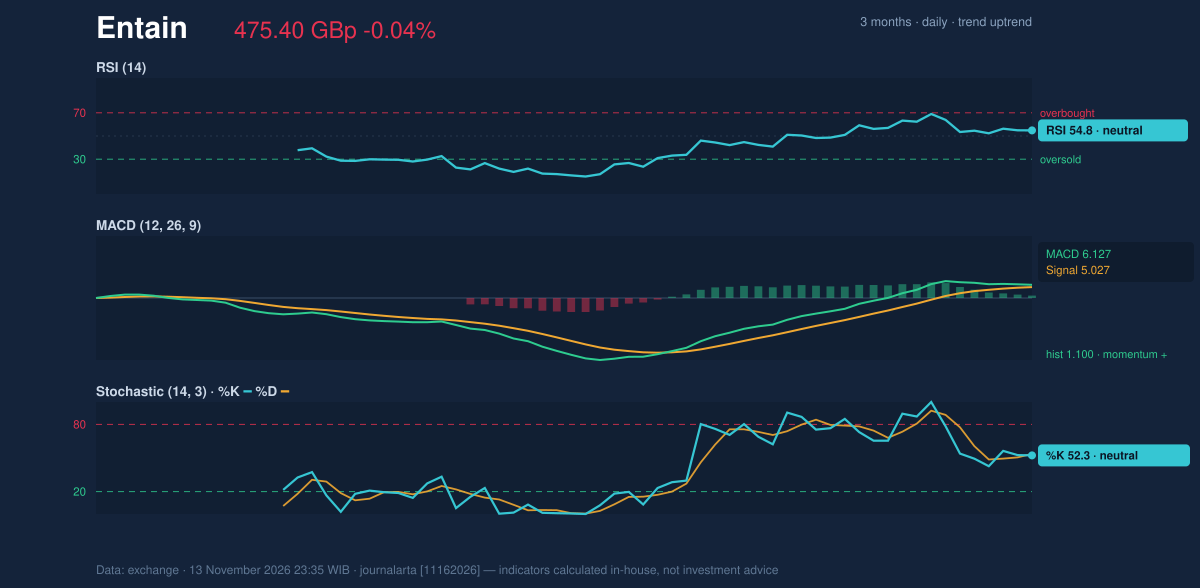
Momentum is positive without being stretched. The RSI(14) is 54.8, in neutral territory. This leaves room for further gains before overbought conditions would warn of exhaustion. The Stochastic %K of 52.3 and %D of 53.7 are also neutral, so neither oscillator signals a short-term extreme.
The MACD is 6.127 against a signal line of 5.027, a histogram of 1.100. MACD measures the gap between a faster and a slower moving average. With the line above its signal, short-term momentum is stronger than its recent baseline. That matches the golden cross rather than adding independent confirmation.
Volatility & Volume
The Bollinger bands (20 days, 2 standard deviations) run from 433.41 at the lower edge to 498.29 at the upper, with the midline at 465.85. At a band width of 13.9%, they are in a normal range, and a %B of 65% places the price in the upper half but not near the ceiling. The market is not squeezed into a tight range, and it is not stretched either.
The ATR(14) of 17.57 equals 3.7% of the price, which marks high volatility. In plain terms, the stock routinely moves about 17.57 pence in a session. That is the main risk factor in this setup, because wide daily swings can trigger protective levels even when the broader trend holds.
Volume is the weak spot. Friday's turnover of 1,422,295 shares was only 0.6 times the 20-day average of 2,577,386, a thin session. A move on light volume carries less weight than one on heavy participation. Yet on-balance volume (OBV) is rising, which indicates that over the period, volume has favoured up days over down days. Thin trading today does not erase that broader evidence.
Key Levels & Scenarios
The 20-day support is at 435.10 and resistance at 497.70, with price at 64% of that range. The resistance level sits almost exactly at the upper Bollinger band (498.29), so a close above that zone would be a meaningful test of the trend. A failure to hold 435.10 would put the stock near the lower band at 433.41 and call the current structure into question.
Technical Verdict: BUY
JournalArta's research model rates Entain BUY with a score of +92 on a scale from −100 to +100, where +60 or higher counts as a buy. The reasons:
- Fresh golden cross: the SMA20 moved above the SMA50 one session before the latest session, and price holds above both averages.
- Pullback within an uptrend: price has retraced toward the SMA20 at 465.85 while staying above the SMA50 at 460.59.
- Volume confirmation: OBV is rising, even though the latest session's volume was only 0.6 times average.
Levels computed by the model, valid until 11 Dec 2026:
- Entry range: 462.21 – 475.40
- Exit target 1: 541.13 (reward/risk 1.5)
- Exit target 2: 606.86 (reward/risk 3.0)
- Stop loss: 431.58
The verdict is invalidated if price falls below 431.58, which would also mean a break of the 435.10 support. The 3.7% ATR is a reminder that the stop sits within reach of a few unusually active sessions.
In plain English: the chart shows a steady, improving trend with room to rise, though the stock is still volatile and Friday's low trading volume means the signal has not yet been tested by heavy buying.
Summary Data Entain
| Last price | 475.40 GBp |
| Change 1 day / 5 days / 1 month | -0.04% / 0.98% / 7.14% |
| Trend / MA-cross | uptrend / golden |
| SMA20 / SMA50 | 465.85 / 460.59 |
| RSI (14) / Stochastic %K | 54.8 / 52.3 |
| Bollinger %B / ATR | 65% / 17.57 |
| Support / Resistance 20 days | 435.10 / 497.70 |
| Data as of | 13 November 2026 23:35 WIB |
| JournalArta research verdict (score) | Buy (+92) |
| Entry zone | 462.21 – 475.40 |
| Target 1 / 2 | 541.13 / 606.86 |
| Stop loss | 431.58 |
| Reward/risk | 1.5 / 3.0 |
Today's full Buy and Sell list for UK, Singapore & Hong Kong stocks →
Disclaimer: This technical analysis is generated automatically from exchange data and indicators calculated by JournalArta, for information and education only. The verdict and the entry, target and stop-loss levels are not investment advice or a solicitation to buy or sell any security. Investment decisions and their risks rest solely with the reader.
Track Entain share price daily: live levels, support/resistance and our full Entain analysis history.
 Take the quizWhat Kind of Holiday Spender Are You? Take the Black Friday QuizStart →
- 1I’m A Celebrity 2026 Line-Up: Rooney Leads 11 Stars Into Jungle

- 2Mavericks Surfers Race to California for Waves Near 50 Feet

- 3NYC Medical Examiner Has Not Determined Cause of Death of Beau Rose Jessup

- 4Mountaineer Finds Ice Age Cave Bear Graveyard in the Dolomites

- 5Rugby League World Cup Final 2026: Kick-Off Times and How to Watch Kangaroos v New Zealand

 Lifestyle7 Signs Your Social Battery Is Running Low (and Why You Keep Cancelling Plans)
 Lifestyle · Food & HealthThanksgiving Food Safety: How Long Leftovers Last and the Safe Turkey Temperature
 Lifestyle7 Quiet Habits of Emotionally Intelligent People, According to Psychologists
 LifestylePeople Who Don’t Like Celebrating Their Birthday Often Share These 7 Traits