Unilever Share Price Latest: Rises 1.20% on Friday, Up 1.2% in Five Sessions
Technical analysis of Unilever stock on November 13, 2026: price 4,987.50 GBp, trend uptrend, RSI 59.3, support 4,771.50, resistance 5,032.00.
Why Unilever is in focus today
Selected automatically from 7 LSE (UK) stocks by a technical-signal score with daily weighted randomisation — not a recommendation.
Trend & Price Action
The structure is orderly. Price sits above both the 20-day simple moving average (SMA20) at 4,908.40 and the 50-day (SMA50) at 4,758.59, and the shorter average remains above the longer one. That ordering is the textbook signature of an uptrend. The data shows no fresh moving-average crossover, so this is a trend already in place, not a new turn. The 20-day average itself rose 0.54% over five days, a gentle slope that points to persistence rather than acceleration. The code-generated signal list flags a pullback to the SMA20 within an uptrend, with price still above the SMA50. In plain terms, the stock dipped toward its short-term average, found buyers and bounced, which is how healthy trends often advance. The last price is 79 pence above the SMA20, so the retest has already held.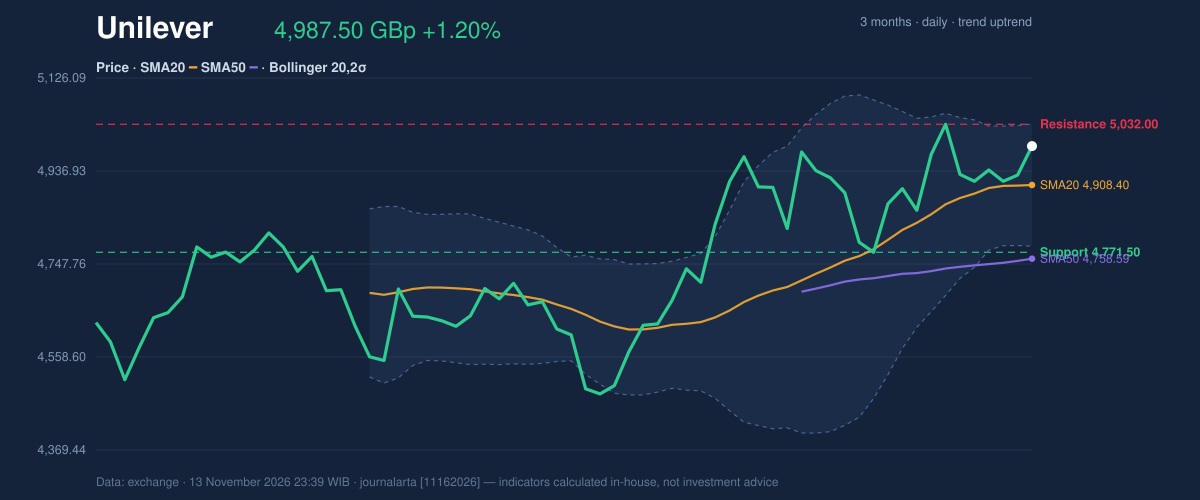
Oscillators & Momentum
Momentum indicators are constructive but not stretched. The 14-day Relative Strength Index (RSI), which measures the speed of recent gains against losses on a 0-100 scale, reads 59.3, firmly neutral. Readings above 70 usually signal overbought conditions, so there is headroom before buying pressure looks exhausted. The Stochastic oscillator, which compares the close with the recent trading range, shows %K at 70.2 and %D at 59.5. The faster line is above the slower one, a mildly positive alignment, though it is approaching the upper zone. The one dissenting voice is the MACD, a trend-following gauge built from two moving averages. It reads 53.396 against a signal line of 55.577, leaving a histogram of -2.181. A negative histogram means short-term momentum is cooling relative to its own recent trend, even as price edges up. This is a mild divergence, not a sell signal, but it hints that Friday's advance had less force behind it than the headline gain suggests.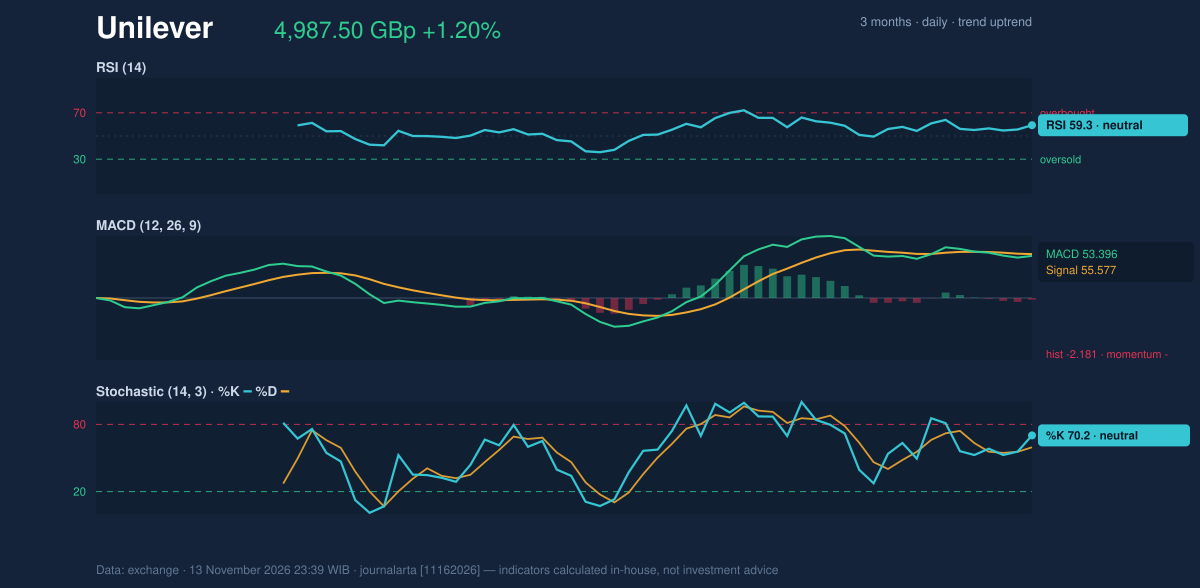
Volatility & Volume
The Bollinger Bands, which draw a range two standard deviations around the 20-day average, have narrowed to a width of 5.1%: upper band 5,032.82, middle 4,908.40, lower 4,783.98. Price sits at 82% of the band (%B), near the top. A squeeze like this often precedes a sharper move, though the bands do not reveal direction. Notably, the upper band almost coincides with the 20-day resistance at 5,032.00, so one ceiling is effectively doing double duty. The Average True Range (ATR), a measure of typical daily movement, is 117.87 pence, or 2.4% of the price, which counts as moderate volatility. That gives context for scale: a 100-pence swing in either direction would be an ordinary session for this stock. Participation is the weaker link. Friday's volume of 2,227,048 shares was just 0.6 times the 20-day average of 3,616,502. Thin volume on a rising day can mean fewer buyers are willing to commit at higher prices. Offsetting that, On-Balance Volume (OBV), which tallies volume on up days against down days, is rising. That suggests accumulation over recent weeks, even if Friday itself was quiet.Key Levels & Scenarios
Two levels frame the near term. If the shares clear 5,032.00, a close above the upper Bollinger Band would confirm that the squeeze has resolved upward, with the three-month high of 5,109.00 as the next reference. If they fail to hold the SMA20 near 4,908.40, attention shifts to the 20-day support at 4,771.50, which sits just above the SMA50 at 4,758.59.Technical Verdict: BUY
JournalArta's research model rates Unilever BUY, with a score of +84 on a scale running from -100 to +100, where +60 or above triggers a buy call. The strongest reasons: - Trend alignment: price is above the 50-day average, and the 20-day average is above the 50-day, confirming an uptrend. - Signal balance: two bullish technical signals, the pullback to the SMA20 and OBV confirming the uptrend, against zero bearish. - Rising OBV: volume flow supports the price advance despite Friday's light turnover. Levels computed by the model, valid until 11 December 2026: - Entry range: 4,899.23 – 4,987.50 - Exit target: target 1 at 5,346.82 and target 2 at 5,706.15 - Stop loss: 4,747.95 - Reward/risk: 1.5 to target 1, 3.0 to target 2 The verdict is invalidated if price breaks below 4,747.95, which sits under both the 20-day support and the SMA50. The negative MACD histogram and the 0.6× volume reading are the main risks to monitor. For non-traders, the chart-based reading is that Unilever's shares are in a steady uptrend with room to run, though the thin trading volume means the move has yet to be proven by broad participation. This is technical analysis, not an investment recommendation. | Indicator | Value | |---|---| | Last price | 4,987.50 GBp | | SMA20 / SMA50 | 4,908.40 / 4,758.59 | | RSI(14) | 59.3 | | Stochastic %K / %D | 70.2 / 59.5 | | MACD / signal / histogram | 53.396 / 55.577 / -2.181 | | Bollinger upper / lower | 5,032.82 / 4,783.98 | | ATR(14) | 117.87 | | Support / resistance (20-day) | 4,771.50 / 5,032.00 | The next test comes when London reopens on Monday, 16 November, when traders will see whether the shares can press through 5,032.00 on stronger volume.Summary Data Unilever
| Last price | 4,987.50 GBp |
| Change 1 day / 5 days / 1 month | 1.20% / 1.17% / 0.43% |
| Trend / MA-cross | uptrend / none |
| SMA20 / SMA50 | 4,908.40 / 4,758.59 |
| RSI (14) / Stochastic %K | 59.3 / 70.2 |
| Bollinger %B / ATR | 82% / 117.87 |
| Support / Resistance 20 days | 4,771.50 / 5,032.00 |
| Data as of | 13 November 2026 23:39 WIB |
| JournalArta research verdict (score) | Buy (+84) |
| Entry zone | 4,899.23 – 4,987.50 |
| Target 1 / 2 | 5,346.82 / 5,706.15 |
| Stop loss | 4,747.95 |
| Reward/risk | 1.5 / 3.0 |
Today's full Buy and Sell list for UK, Singapore & Hong Kong stocks →
Disclaimer: This technical analysis is generated automatically from exchange data and indicators calculated by JournalArta, for information and education only. The verdict and the entry, target and stop-loss levels are not investment advice or a solicitation to buy or sell any security. Investment decisions and their risks rest solely with the reader.
Track Unilever share price daily: live levels, support/resistance and our full Unilever analysis history.
 Take the quizWhat Kind of Holiday Spender Are You? Take the Black Friday QuizStart →
- 1I’m A Celebrity 2026 Line-Up: Rooney Leads 11 Stars Into Jungle

- 2Mavericks Surfers Race to California for Waves Near 50 Feet

- 3NYC Medical Examiner Has Not Determined Cause of Death of Beau Rose Jessup

- 4Mountaineer Finds Ice Age Cave Bear Graveyard in the Dolomites

- 5Rugby League World Cup Final 2026: Kick-Off Times and How to Watch Kangaroos v New Zealand

 Lifestyle7 Signs Your Social Battery Is Running Low (and Why You Keep Cancelling Plans)
 Lifestyle · Food & HealthThanksgiving Food Safety: How Long Leftovers Last and the Safe Turkey Temperature
 Lifestyle7 Quiet Habits of Emotionally Intelligent People, According to Psychologists
 LifestylePeople Who Don’t Like Celebrating Their Birthday Often Share These 7 Traits