QCOM Stock Week Ahead (November 23–27): What Comes After a 13.06% Weekly Loss
QCOM stock week ahead for November 23–27: last close 149.94 USD, weekly change -13.06%, support 149.94, resistance 185.41.

The last trading session of the week wiped -7.45% off Qualcomm shares, capping a -13.06% weekly slide that left the Nasdaq-listed chipmaker at $149.94 on Friday, November 20, 2026. The move was the worst single-session drop of the week and pulled the stock -14.76% lower over one month, from a prior close of $172.47 on November 13 to a week that opened at $169.24 on November 16 and never recovered.
Volume tells its own story. Friday's turnover reached 22,221,700 shares, roughly 1.5× the 20-day average of 14,789,275, while the full week's average of 13,540,600 matched the prior 20-session average almost exactly at 0.98×. Four down sessions against one up session — the best being a modest +1.38% on November 19 — is the signature of a market selling into strength rather than buying dips.
Last Week in Review
The week's shape matters as much as its size. Qualcomm touched its weekly high of $172.92 in Monday's session on November 16, then gave ground each day before the capitulation on Friday, November 20. The -13.06% weekly change and -7.45% daily change are the same number in one sense — Friday did most of the damage — and the close near the week's floor means buyers have not yet stepped in. The stock finished at 0% of its 20-day range, with the 20-day support at $149.94 — precisely the closing price — and 20-day resistance at $185.41. The three-month high of $205.85 and low of $148.25 frame how far the shares have travelled: the low is just below Friday's finish.Technical Map for the Week Ahead
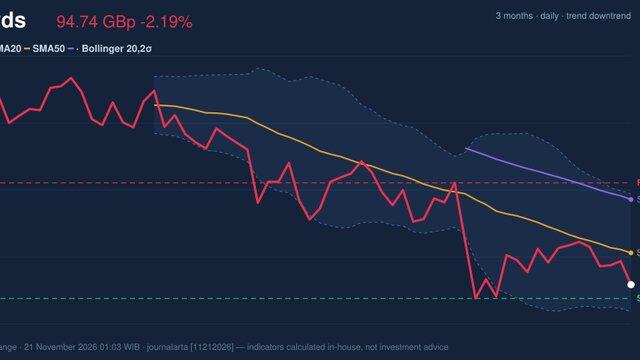
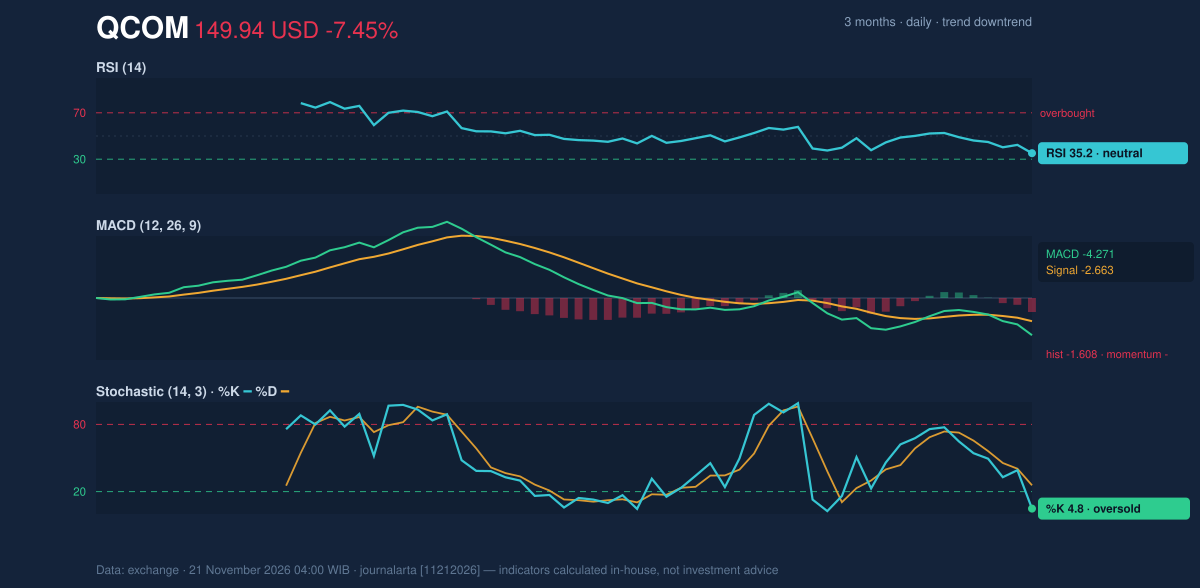
The trend is unambiguous. Price sits below the 20-day average of $169.85 and below the 50-day average of $177.31, and the 20-day average itself is sloping down at -1.99% over five days. No new moving-average cross has formed, but the existing stack is bearish. The Bollinger bands (20, 2σ) run from $188.42 at the top to $151.28 at the bottom, with a band width of 21.9% that is widening — a high-volatility regime. Price closed beneath the lower band, which puts the %B reading at -4%, meaning the shares are stretched below the band's floor. Momentum is negative but not yet exhausted. RSI(14) stands at 35.2, in neutral territory and still above the traditional 30 oversold line, while Stochastic %K at 4.8 against %D at 25.6 is deeply oversold — a setup that can produce sharp relief rallies inside a downtrend. MACD at -4.271 versus a signal line of -2.663 gives a histogram of -1.608, confirming negative momentum. ATR(14) at $10.46, or 7.0% of the price, is the volatility yardstick for the week — expect daily swings of roughly that magnitude.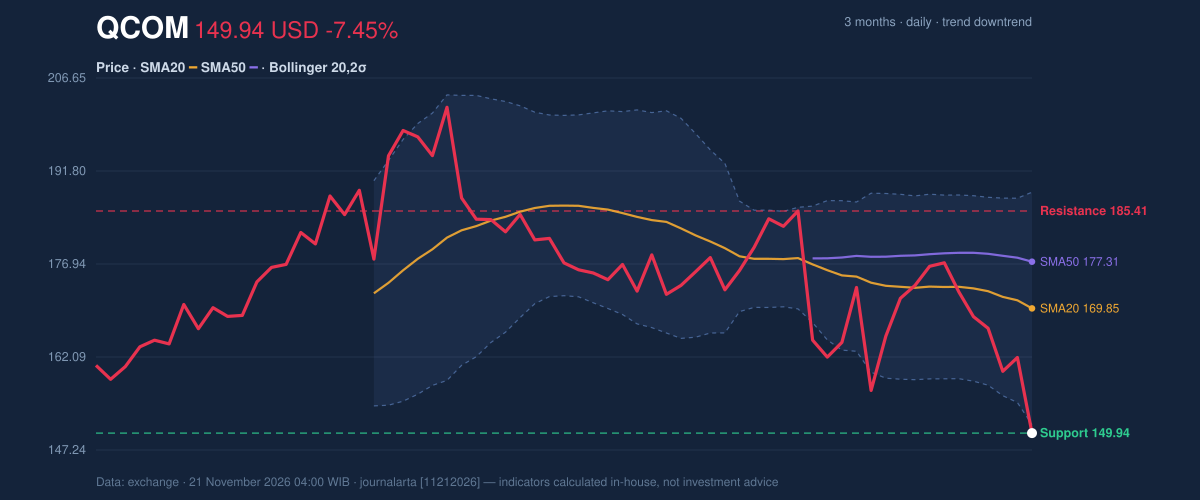
Fundamentals and Catalysts
The fundamental backdrop is a company shrinking at the top line while growing at the bottom. Qualcomm reported annual revenue of $43.12 billion for the fiscal year ended September 27, 2026, down 2.6% from $44.28 billion a year earlier, according to its Form 10-K filed on November 4. Yet net income for the same year reached $13.63 billion, against $5.54 billion a year earlier, with diluted earnings per share of $12.70 — a striking gap between revenue direction and profit direction that points to cost and mix effects rather than volume. The quarterly picture was softer. Fiscal Q4 adjusted earnings were $2.17 per diluted share, down from $3.00 a year earlier, on revenue of $10.32 billion for the three months ended September 27, down from $11.27 billion, as reported on November 3. On November 13, the company filed a Form 8-K with the U.S. Securities and Exchange Commission reporting a material definitive agreement and other material events — a disclosure that lands squarely in the window the market was digesting.Macro, Political and Global Factors
No additional macro, political or global facts were available in the verified research for this period. The dominant force in the tape is the company-specific and technical picture described above, with the November 13 regulatory filing the most recent dated disclosure.Risks and What Would Invalidate the Scenario
The bearish setup has three technical pillars: the close below the 20-day low on volume at least 1.5× average, the MACD histogram turning negative, and a downtrend confirmed by falling on-balance volume. Each carries a counter-risk. First, the Stochastic reading at %K 4.8 is as oversold as it gets; mean-reversion rallies from such levels can be violent, and with ATR at $10.46 a single session can erase a large part of the week's decline. Second, the price closed exactly at the 20-day support of $149.94 — a level that has held on the close. If buyers defend it and push back above the Bollinger lower band at $151.28, the bearish trigger weakens. Third, RSI at 35.2 is not yet in oversold territory, which cuts both ways: it leaves room for further downside, but it also means the selling has not reached the exhaustion that typically marks a durable bottom. For the bullish case, invalidation comes at $148.25, the three-month low. A break below that level would show the relief argument is wrong and the downtrend is extending. For the bearish case, invalidation arrives if price reclaims the $157.78 edge of the sell zone and holds above the 20-day average of $169.85.Technical Verdict for the Week: SELL
The computed JournalArta reading scores -89 on a −100 to +100 scale, with zero bullish signals against three bearish ones: the close below the 20-day low on volume at least 1.5× average, the MACD histogram just turning negative, and falling on-balance volume. Price trades below both the 50-day average of $177.31 and a 20-day average at $169.85 that is itself below the 50-day — a fully aligned downtrend. The RSI at 35.2 and Stochastic at %K 4.8 are the main risks to the call; oversold conditions can spark rallies, but they have not yet produced a single bullish technical trigger. - Entry Range: $149.94 – $157.78 - Target 1: $123.24 - Target 2: $96.54 - Stop Loss: $167.74 Verdict invalidated if price breaks above the stop at $167.74, which would put the shares back above the 20-day average of $169.85's neighbourhood and force a reassessment. In plain terms: the chart says the sellers are still in control, and the burden of proof sits with the buyers to reclaim the 20-day average before this call changes. The verdict levels carry a validity window through December 19, 2026, with a reward-to-risk profile of 1.5 to 1 on the first target and 3.0 to 1 on the second.QCOM Week Ahead Data
| Trading week | November 16 – November 20 (5 sessions) |
| Weekly change | -13.06% (172.47 → 149.94 USD) |
| Week high / low | 172.92 (November 16) / 149.13 (November 20) |
| Best / worst session | 1.38% (November 19) / -7.45% (November 20) |
| Avg daily volume vs prior 20 sessions | 13,540,600 vs 13,752,580 (0.98x) |
| SMA20 / SMA50 | 169.85 / 177.31 |
| RSI (14) / Stochastic %K | 35.2 / 4.8 |
| Support / Resistance 20 days | 149.94 / 185.41 |
| 3-month high / low | 205.85 / 148.25 |
| Week covered | November 23–27, 2026 |
| Data as of | 21 November 2026 04:00 WIB |
| JournalArta research verdict (score) | Sell (-89) |
| Sell zone | 149.94 – 157.78 |
| Target 1 / 2 | 123.24 / 96.54 |
| Stop loss | 167.74 |
| Reward/risk | 1.5 / 3.0 |
Disclaimer: This technical analysis is generated automatically from exchange data and indicators calculated by JournalArta, for information and education only. The verdict and the entry, target and stop-loss levels are not investment advice or a solicitation to buy or sell any security. Investment decisions and their risks rest solely with the reader.
Track QCOM stock price daily: live levels, support/resistance and our full QCOM analysis history.
 Take the quizWhat Kind of Holiday Spender Are You? Take the Black Friday QuizStart →
Most Read
- 1Stock Market Today: Dow Slides 1.34% and VIX Jumps 15% at Midday

- 2Joachim Klement to Sell Stocks After S&P 500 Signal

- 3Stock Market Today: Nasdaq, S&P 500 Futures Slide as AI Selloff Deepens
- 4Kenneth Walker’s Groin Injury Puts Cardinals Game in Doubt

- 5Pat Cummins Faces Captaincy Doubts From Mitchell Johnson

Don't Miss
 Markets · FintechHow to Calculate Compound Interest: Formula, Examples and the Rule of 72
 Lifestyle · Food & HealthNormal Blood Pressure Chart by Age: Healthy Ranges Explained
 Lifestyle · Food & HealthWhat Is Raynaud’s Syndrome? Why Fingers Turn White in the Cold
 Lifestyle · Food & Health4 Ways Walking After Meals Helps Your Body, Doctors Say