FedEx (FDX) Stock Analysis: Rises 3.47%, Golden Cross Formed
Technical analysis of FDX stock on November 9, 2026: price 318.84 USD, trend uptrend, RSI 59.2, support 290.59, resistance 329.40.
Why FDX is in focus today
- Fresh golden cross: SMA20 crossed above SMA50
- Not covered by JournalArta in the last 14 days
Selected automatically from 80 NYSE (US) stocks by a technical-signal score with daily weighted randomisation — not a recommendation.
Trend & Price Action
The longer view is more measured. FedEx is up 9.11% over one month but only 0.19% over five days, which means most of the monthly gain was already in place before Monday's jump. In practical terms, the stock spent the past week mostly consolidating, then moved sharply on the final session. The last price of $318.84 sits at 73% of its 20-day range, between support at 290.59 and resistance at 329.40. Over three months the stock has traded between 279.23 and 341.69, so it remains below its quarterly peak with room before that ceiling.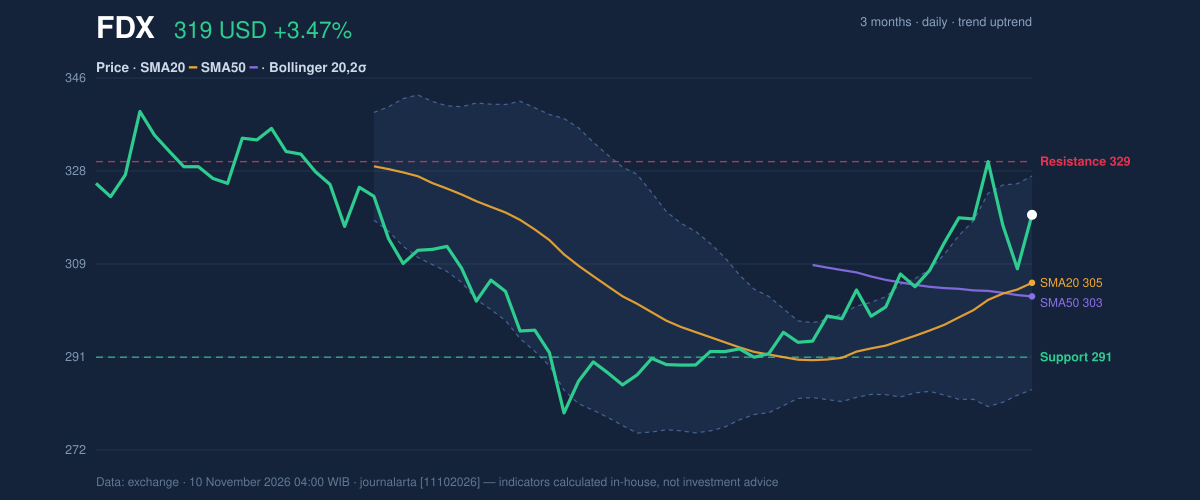
Oscillators & Momentum
Momentum supports the trend without looking stretched. The Relative Strength Index (RSI, a 0–100 gauge of recent buying versus selling pressure) reads 59.2, neutral and well short of the 70 level usually associated with overheating. The Stochastic oscillator, which compares the close to its recent range, shows %K at 63.7 against %D at 54.6, also neutral, with the faster line above the slower one. The MACD, a trend-following momentum gauge, stands at 5.247 against a signal line of 3.587. The histogram of 1.660 is positive, meaning upward momentum is still widening.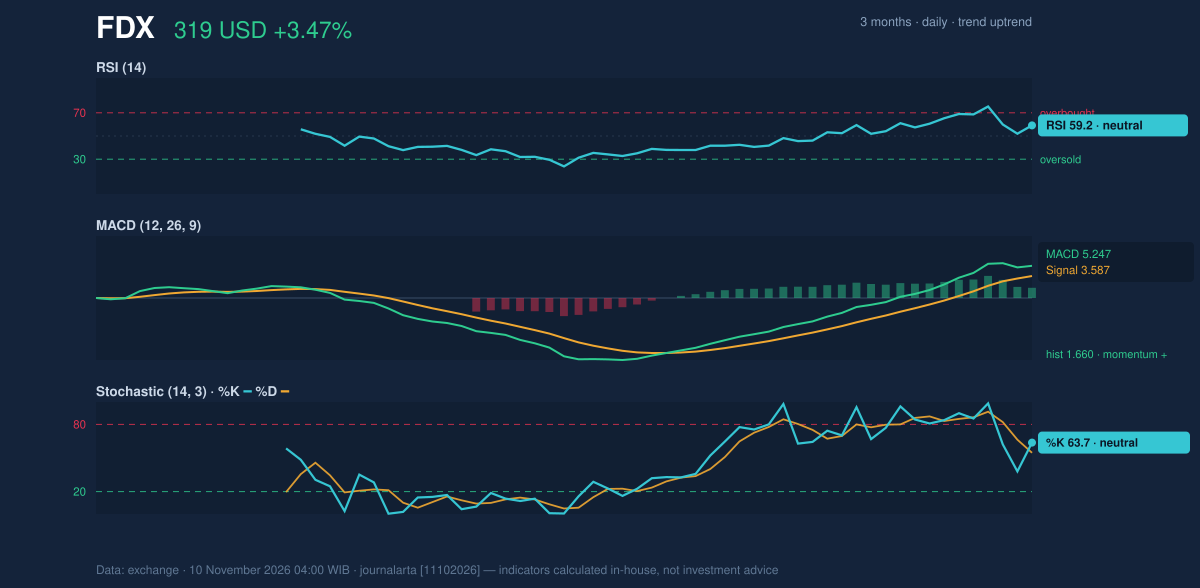
Volatility & Volume
The Bollinger Bands, which draw a range two standard deviations around the 20-day average, run from 284.16 to 326.56. The price sits at 82% of that band (%B), near the upper edge, while the band width of 13.9% is normal rather than compressed or exploding. The Average True Range (ATR) of 9.41, or 3.0% of the price, points to moderate daily swings. Volume is the weaker link. Monday's turnover of 1,043,000 shares was only 0.7 times the 20-day average of 1,487,465. A 3.47% move on below-average volume suggests fewer participants drove it, which is why traders often want to see follow-through. On the other hand, On-Balance Volume (OBV), which tallies volume on up days against down days, is rising, so the longer pattern of money flow is still positive.Fundamental Context
According to its Form 10-Q filed October 28, FedEx reported quarterly revenue of $22.86 billion for the quarter ended September 30, up 11.9% from $20.43 billion a year earlier. Net income was $290.0 million, down from $920.0 million, with diluted earnings per share of $1.21. Revenue growth alongside sharply lower profit is the tension behind the stock's recent trading. The company also filed a Form 8-K with the U.S. Securities and Exchange Commission on November 9 reporting a change of directors or officers, though the filing summary gives no further detail here.Technical Verdict: BUY
JournalArta's research model rates FDX BUY, with a score of +76 on a scale from −100 to +100, above the +60 threshold. The strongest reasons: - Trend: price above the SMA50 and a fresh golden cross, with the 20-day average above the 50-day. - Signal balance: three bullish technical signals against one bearish. - Participation: OBV is rising, confirming the uptrend, even though Monday's volume was light. Levels, valid until December 8, 2026: - Entry range: 311.79 – 318.84 - Exit target 1: 342.82 (reward/risk 1.5) - Exit target 2: 366.81 (reward/risk 3.0) - Stop loss: 302.85 The verdict is invalidated if the price falls below 302.85, which would also put it under the SMA50 at 302.66 and undo the golden cross. In plain terms, the chart favors further gains for FedEx, but this is technical analysis, not investment advice, and the stock's light trading volume means the move still needs confirmation. | Indicator | Value | |---|---| | Last price | 318.84 USD | | 1-day / 5-day / 1-month change | 3.47% / 0.19% / 9.11% | | SMA20 / SMA50 | 305.36 / 302.66 | | RSI(14) | 59.2 | | Stochastic %K / %D | 63.7 / 54.6 | | MACD / signal / histogram | 5.247 / 3.587 / 1.660 | | Bollinger upper / lower | 326.56 / 284.16 | | ATR(14) | 9.41 | | Support / resistance (20 days) | 290.59 / 329.40 | | 3-month high / low | 341.69 / 279.23 |Summary Data FDX
| Last price | 318.84 USD |
| Change 1 day / 5 days / 1 month | 3.47% / 0.19% / 9.11% |
| Trend / MA-cross | uptrend / golden |
| SMA20 / SMA50 | 305.36 / 302.66 |
| RSI (14) / Stochastic %K | 59.2 / 63.7 |
| Bollinger %B / ATR | 82% / 9.41 |
| Support / Resistance 20 days | 290.59 / 329.40 |
| Data as of | 10 November 2026 04:00 WIB |
| JournalArta research verdict (score) | Buy (+76) |
| Entry zone | 311.79 – 318.84 |
| Target 1 / 2 | 342.82 / 366.81 |
| Stop loss | 302.85 |
| Reward/risk | 1.5 / 3.0 |
Today's full Buy and Sell list for US stocks →
Disclaimer: This technical analysis is generated automatically from exchange data and indicators calculated by JournalArta, for information and education only. The verdict and the entry, target and stop-loss levels are not investment advice or a solicitation to buy or sell any security. Investment decisions and their risks rest solely with the reader.
Track FDX stock price daily: live levels, support/resistance and our full FDX analysis history.