Palo Alto Networks (PANW) Stock on Monday: Rises 5.43%, Death Cross Pressure
Technical analysis of PANW stock on November 9, 2026: price 330.89 USD, trend downtrend, RSI 39.6, support 313.84, resistance 401.70.

Why PANW is in focus today
- Fresh death cross: SMA20 crossed below SMA50
- Downtrend extending (5-day change -5.92%)
Selected automatically from 100 NASDAQ (US) stocks by a technical-signal score with daily weighted randomisation — not a recommendation.
Trend & Price Action
A bounce is not a reversal, and the structure shows why. The price sits below both the 20-day simple moving average (SMA20) at 359.84 and the 50-day (SMA50) at 369.48. The death cross formed two sessions before the latest session, when the shorter average crossed below the longer one. Traders read this as a sign that recent prices are consistently lower than the medium-term norm. The 20-day average itself fell 5.13% over five days, so the drag is broad and not a one-day event. The stock trades at 19% of its 20-day range, between support at 313.84 and resistance at 401.70. Its three-month range runs from a low of 312.12 to a high of 432.33. Monday's close is therefore roughly $19 above the three-month low, and about $29 below the SMA20.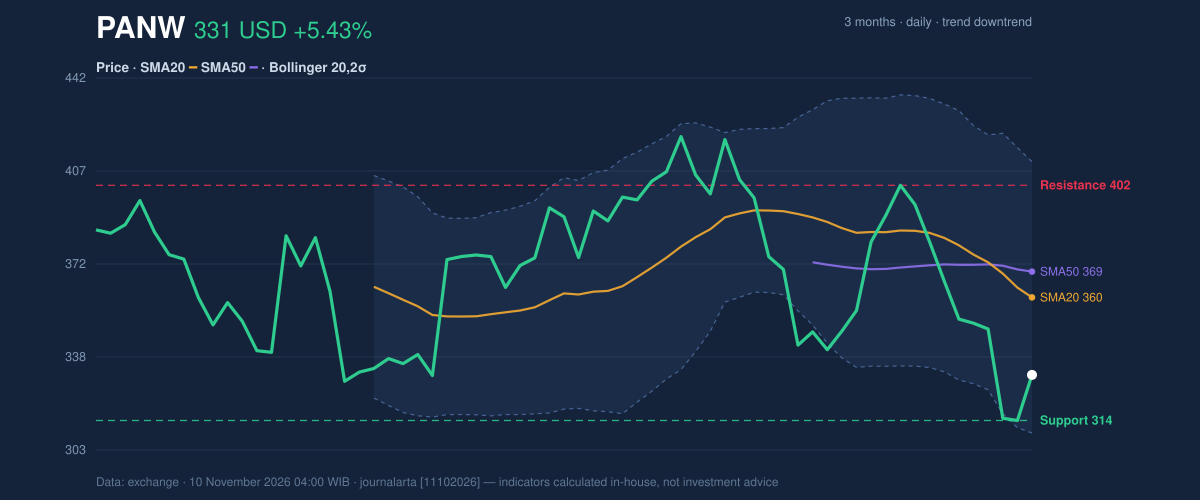
Oscillators & Momentum
Momentum gauges point the same way as trend, with one caveat. The 14-day Relative Strength Index (RSI) is 39.6, which is neutral. The Stochastic oscillator is more stretched, with %K at 19.8 and %D at 8.1, both in oversold territory. Oversold means the price has fallen quickly relative to its recent range. It can precede a bounce, which may be what Monday showed, but it does not by itself end a downtrend. The MACD, a gauge comparing two moving averages of price, is more cautious. It reads -12.988 against a signal line of -7.053, leaving a histogram of -5.935. The line is still below its signal, so negative momentum has not been repaired by one strong session.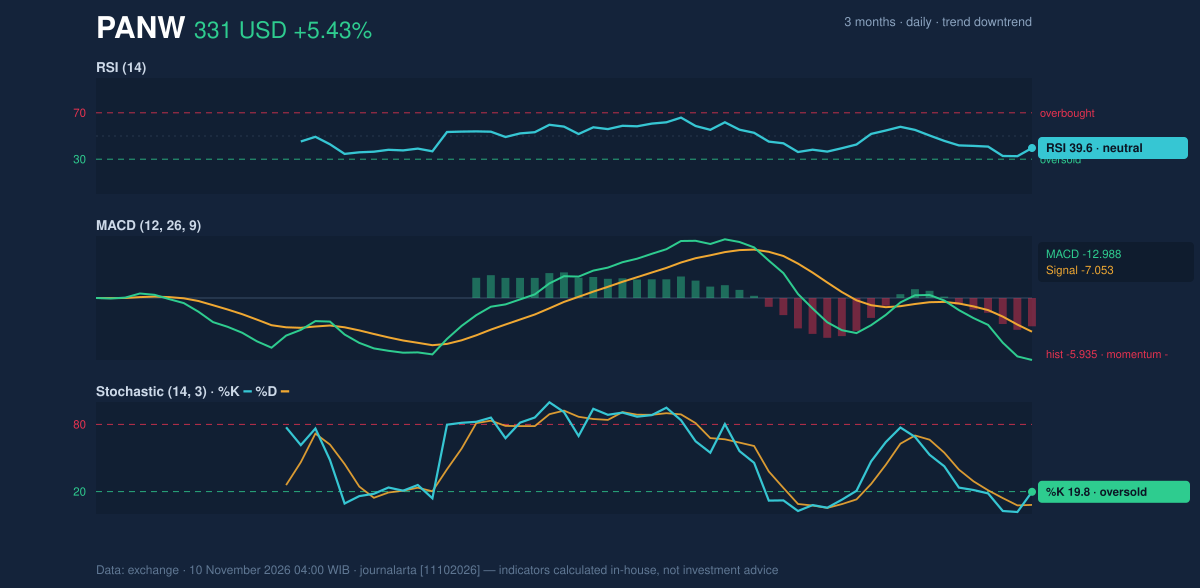
Volatility & Volume
Bollinger Bands, which sit two standard deviations around the 20-day average, show an upper band at 410.53 and a lower band at 309.14. The band width is 28.2% and widening, a sign of high volatility. Price sits at 21% of the band (%B), near the lower edge. The Average True Range (ATR) is 20.88, or 6.3% of the price, meaning daily swings of this size are normal for the stock right now. Volume tells a weaker story about the rebound. Monday's 5,839,200 shares was 0.9 times the 20-day average of 6,282,570. A bounce on below-average volume suggests limited conviction among buyers. On-balance volume (OBV), which tracks whether volume flows into rising or falling sessions, is still falling.Key Levels & Scenarios
The nearest floor is 313.84, just beside the three-month low of 312.12. A close below that area would extend the slide toward the lower Bollinger band at 309.14 and beyond. On the upside, the SMA20 at 359.84 and the SMA50 at 369.48 form a ceiling. A sustained move above them would challenge the downtrend reading.Fundamental Context
The weak chart contrasts with the company's growth. According to its SEC filing (Form 10-K, filed September 10, 2026), Palo Alto Networks reported annual revenue of $11.48 billion for the fiscal year ended July 31, 2026, up 24.5% from $9.22 billion a year earlier. Net income was $306.6 million, compared with $1.13 billion the year before, and diluted earnings per share were $0.40. Revenue grew while profit fell sharply, and the share price has been adjusting to that gap.Technical Verdict: SELL
The JournalArta research score is -76 on a scale of -100 to +100, below the -60 threshold for a SELL reading. The strongest reasons: - Price below the 50-day average: the stock trades at 330.89 against an SMA50 of 369.48, and the SMA20 is below it after the death cross. - Bearish signals outnumber bullish ones, 3 to 1: the bearish side includes the death cross, a bounce into the SMA20 within a downtrend, and falling OBV. The only bullish signal is an RSI rebound from below 35. - Momentum confirms the trend: the MACD histogram is -5.935 and the stock sits in a downtrend. The levels below are valid until December 8, 2026: - Entry range (sell zone): 330.89 to 346.54 - Exit target 1: 277.64 - Exit target 2: 224.39 - Stop loss: 366.39 - Reward/risk: 1.5 to target 1, 3.0 to target 2 The verdict is invalidated if the price rises above 366.39, a level that sits just below the SMA50 at 369.48. This is technical analysis, not an investment recommendation. In plain terms: the chart shows a stock that bounced hard but remains in a clear downtrend, and the signals favor further weakness unless it climbs back above 366.39.Summary Data PANW
| Last price | 330.89 USD |
| Change 1 day / 5 days / 1 month | 5.43% / -5.92% / -18.06% |
| Trend / MA-cross | downtrend / death |
| SMA20 / SMA50 | 359.84 / 369.48 |
| RSI (14) / Stochastic %K | 39.6 / 19.8 |
| Bollinger %B / ATR | 21% / 20.88 |
| Support / Resistance 20 days | 313.84 / 401.70 |
| Data as of | 10 November 2026 04:00 WIB |
| JournalArta research verdict (score) | Sell (-76) |
| Sell zone | 330.89 – 346.54 |
| Target 1 / 2 | 277.64 / 224.39 |
| Stop loss | 366.39 |
| Reward/risk | 1.5 / 3.0 |
Today's full Buy and Sell list for US stocks →
Disclaimer: This technical analysis is generated automatically from exchange data and indicators calculated by JournalArta, for information and education only. The verdict and the entry, target and stop-loss levels are not investment advice or a solicitation to buy or sell any security. Investment decisions and their risks rest solely with the reader.
Track PANW stock price daily: live levels, support/resistance and our full PANW analysis history.