Home Depot (HD) Stock Falls 0.68% (November 10, 2026): Testing Key Resistance
Technical analysis of HD stock on November 10, 2026: price 351.00 USD, trend uptrend, RSI 66.0, support 295.51, resistance 355.44.

Why HD is in focus today
- Uptrend confirmed (5-day change 5.20%)
Selected automatically from 80 NYSE (US) stocks by a technical-signal score with daily weighted randomisation — not a recommendation.
Trend & Price Action
At $351.00, the stock sits just below its 20-session resistance of $355.44 and at 93% of its 20-session range. It is also below its three-month high of $362.44. That places the shares near the upper end of recent trading, where a sustained break above resistance would show buyers are pushing beyond the current range; a failure to clear it could leave the price consolidating after its strong monthly rise. The 20-day average at $327.09 is a nearer measure of trend support, while the 50-day average at $310.32 provides a deeper reference. The 20-session support level is $295.51. These levels matter because a pullback toward them would test whether the uptrend can hold, rather than merely whether the stock can extend its recent gains.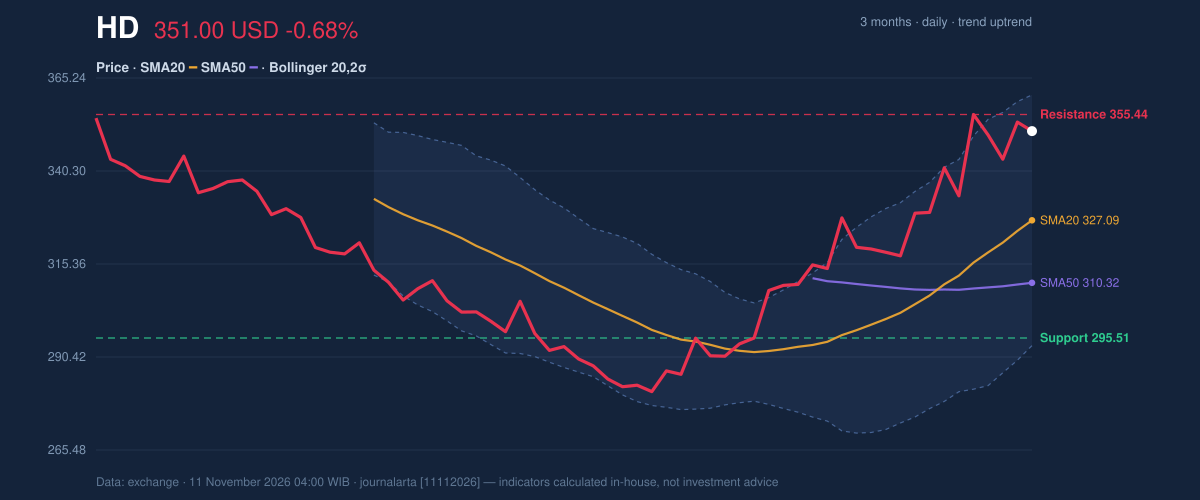
Oscillators & Momentum
Momentum readings remain positive without showing an extreme reading in the supplied data. The RSI is 66.0, classified as neutral; RSI measures the pace of recent gains and losses, and this level is consistent with strength but below the range commonly associated with an overbought reading. The Stochastic is also neutral, with %K at 76.6 and %D at 74.1. Its two lines are close, offering limited evidence of a sharp momentum turn. The MACD is positive: its reading of 12.326 is above the 9.392 signal line, and the histogram is 2.934. This alignment supports the upward trend, although momentum indicators describe recent price behavior rather than guarantee its continuation.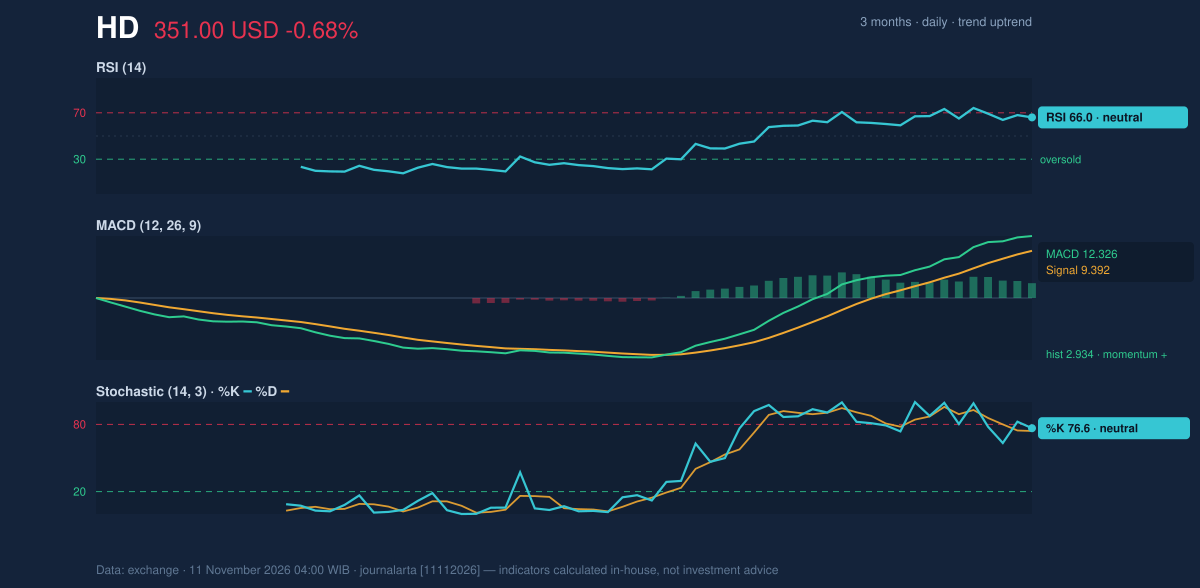
Volatility & Volume
Home Depot’s Bollinger position is elevated: %B is 86%, meaning the price is closer to the upper band than the lower band. The bands are widening, with a width of 20.6%, a signal of higher volatility and a broader recent price range—not, by itself, proof that the stock must reverse. The upper band at $360.70 is near the three-month high, adding to the importance of that area as a test. The 14-session average true range, a measure of typical price movement, is $10.50, or 3.0% of the share price, indicating moderate volatility. Latest volume was 3,743,400 shares, compared with a 20-session average of 4,759,455, or 0.8 times normal. That lighter turnover tempers the force of the latest move, while rising OBV—an indicator that tracks buying and selling volume over time—supports the broader trend’s participation.Fundamental Context
According to its SEC filing, Home Depot reported quarterly revenue of $47.86 billion for the quarter ended August 2, 2026, up 5.7% from $45.28 billion a year earlier. Net income was $4.77 billion, compared with $4.55 billion, and diluted earnings per share were $4.79. The figures provide a business backdrop to the share-price trend; the verdict below is based on the stated technical signals.Technical Verdict: BUY
JournalArta Research’s technical score is +68 on a −100 to +100 scale, meeting its stated threshold for a BUY verdict. The strongest supporting signals are the confirmed uptrend with rising OBV, the price above its 50-day average with the 20-day average above the 50-day, and RSI at 66.0 within the stated 50–70 zone. One important risk is the stock’s proximity to resistance: it is already at 93% of its 20-session range, while the widening Bollinger bands point to higher volatility. The verdict is invalidated if the price falls below $333.15. - Ideal entry range: $343.13–$351.00 - Exit targets: $377.77 (Target 1) and $404.55 (Target 2) - Stop-loss protection: $333.15 - Validity: Through December 9, 2026 The technical setup is positive under JournalArta’s rules, but the price is approaching resistance and may move more sharply as volatility rises.Summary Data HD
| Last price | 351.00 USD |
| Change 1 day / 5 days / 1 month | -0.68% / 5.20% / 19.42% |
| Trend / MA-cross | uptrend / none |
| SMA20 / SMA50 | 327.09 / 310.32 |
| RSI (14) / Stochastic %K | 66.0 / 76.6 |
| Bollinger %B / ATR | 86% / 10.50 |
| Support / Resistance 20 days | 295.51 / 355.44 |
| Data as of | 11 November 2026 04:00 WIB |
| JournalArta research verdict (score) | Buy (+68) |
| Entry zone | 343.13 – 351.00 |
| Target 1 / 2 | 377.77 / 404.55 |
| Stop loss | 333.15 |
| Reward/risk | 1.5 / 3.0 |
Today's full Buy and Sell list for US stocks →
Disclaimer: This technical analysis is generated automatically from exchange data and indicators calculated by JournalArta, for information and education only. The verdict and the entry, target and stop-loss levels are not investment advice or a solicitation to buy or sell any security. Investment decisions and their risks rest solely with the reader.
Track HD stock price daily: live levels, support/resistance and our full HD analysis history.