MercadoLibre (MELI) Stock Slides 2.44% on Thursday, Down 20.6% in a Month
Technical analysis of MELI stock on November 12, 2026: price 1,475.09 USD, trend downtrend, RSI 31.7, support 1,475.09, resistance 1,879.50.
By Alistair Sterling
November 13, 20265 min read
Logo MercadoLibre — JournalArta illustration
Why MELI is in focus today
One-day move of 0.00%, about 0.0× its average daily range (ATR)
Selected automatically from 11 NASDAQ (US) stocks by a technical-signal score with daily weighted randomisation — not a recommendation.
MercadoLibre shares closed Thursday's session (November 12) at $1,475.09, the bottom of their 20-day range and a hair above the three-month low of $1,465.06. That is notable because the Latin American e-commerce and payments group reported 44.2% revenue growth a week earlier. The market is pricing something other than the headline growth rate.
Advertisement
Trend & Price Action
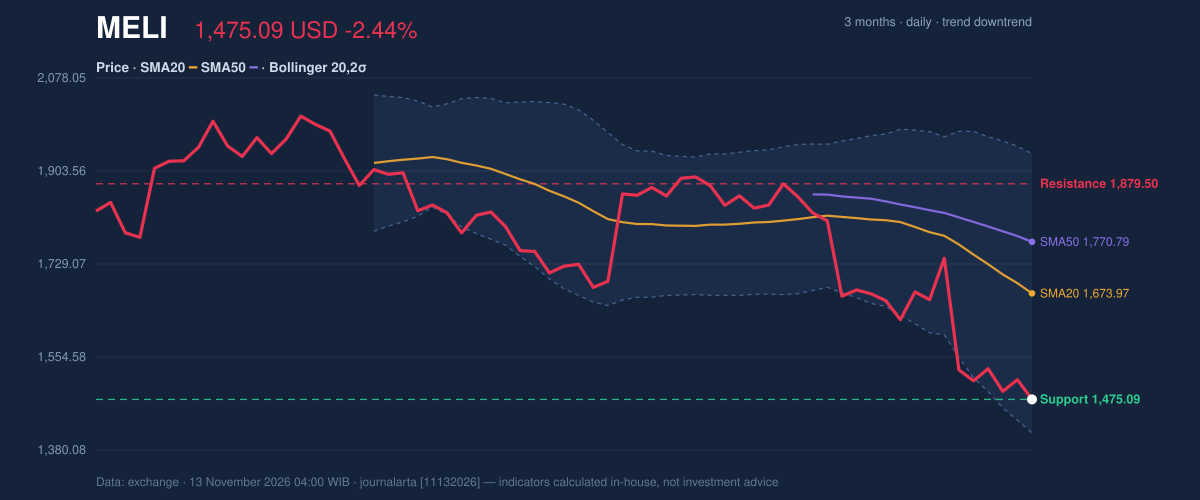
MELI fell 2.44% on the day, 3.61% over five days and 20.57% over one month. The stock sits below both its 20-day average ($1,673.97) and its 50-day average ($1,770.79). The 20-day line is itself under the 50-day line, and no fresh crossover has formed. In plain terms, sellers have controlled this stock for weeks, and the damage did not come from a single bad session.
The slope shows the same pattern. The 20-day average fell 5.19% over five days, so the stock's recent average cost is dropping, not just its latest price. Rallies have been sold into, as the chart shows.
3-month price action chart of MELI: price, SMA20/50, Bollinger, support & resistance.
Advertisement
The 20-day range runs from $1,475.09 (support) to $1,879.50 (resistance), and the price sits at 0% of that band. A stock parked on its floor can bounce or break through. Bollinger Bands help here: the lower band is at $1,411.81 and the upper at $1,936.12, with the band width at 31.3% and widening. Wider bands mean larger daily swings. The %B reading of 12% says the price is hugging the lower edge without having pierced it.
Oscillators & Momentum
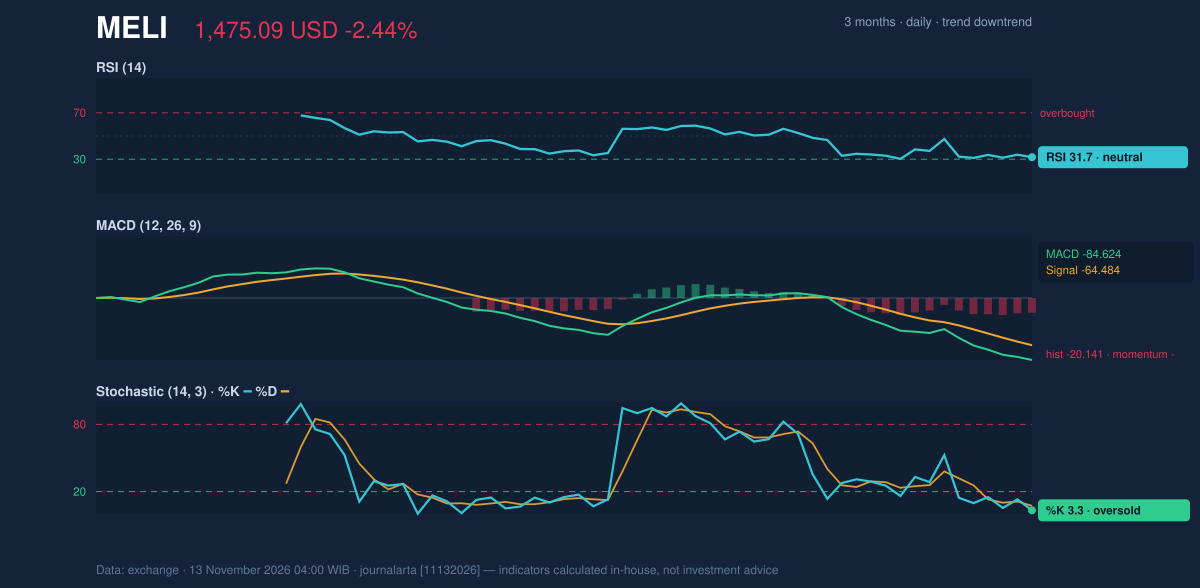
Momentum indicators disagree on how stretched the move is, which matters for interpretation. The Stochastic oscillator, which compares the close with the recent high-low range, reads 3.3 (%K) and 7.3 (%D), deep in oversold territory. The RSI, a broader measure of buying versus selling strength, stands at 31.7, still classed as neutral and just above the usual 30 oversold line.
That gap is the story. The fast gauge says the stock is exhausted on the downside. The slower gauge says the selling has room to run before it looks extreme.
The MACD, which tracks the gap between short- and long-term averages, is at -84.624 against a signal line of -64.484. The histogram is -20.141. A negative histogram that is still widening means downside momentum is intact, not fading.
Momentum chart of MELI: RSI(14), MACD, Stochastic.
Advertisement
Volatility & Volume
The 14-day Average True Range is 82.86, or 5.6% of the price. That is high volatility: a typical day can move the stock by roughly the amount it fell on Thursday.
Participation is more ambiguous. Thursday's volume was 536,000 shares, only 0.7 times the 20-day average of 720,065. Falling prices on below-average volume can mean sellers are running out of steam. But the On-Balance Volume line, which accumulates volume on up days and subtracts it on down days, is also falling. The downtrend is confirmed, not contradicted, by volume flow.
What the Filings Say
According to its Form 10-Q filed on November 5, MercadoLibre reported quarterly revenue of $7.51 billion for the quarter ended September 30, up 44.2% from $5.21 billion a year earlier. Net income was $448.0 million, against $421.0 million a year earlier, and diluted earnings per share were $8.83. The company also filed a Form 8-K with the U.S. Securities and Exchange Commission on November 4 covering its results of operations and financial condition.
Revenue is growing far faster than profit. For a company priced on growth, that gap can matter more to investors than the top-line number. The technical picture suggests the market is focused on exactly that. The filings do not explain the decline, and this analysis does not claim they do.
Advertisement
Key Levels & Scenarios
The $1,465.06 three-month low is the nearest line in the sand. A close below it would put the price in territory it has not visited in three months and, with the lower Bollinger band at $1,411.81, leave little chart support nearby. If the stock instead holds $1,475.09, an oversold bounce toward the 20-day average at $1,673.97 is plausible, although that average is falling and acts as a ceiling.
Technical Verdict: SELL
JournalArta's research model scores MELI at -68 on a scale of -100 to +100, below the -60 threshold that triggers a SELL call. The strongest reasons:
- Trend structure: the price is below the 50-day average, and the 20-day average is below the 50-day, in a confirmed downtrend.
- Momentum: the MACD histogram of -20.141 shows selling pressure still building, and RSI at 31.7 has not yet reached an extreme.
- Volume flow: falling OBV confirms the decline.
Levels, computed from the data:
- Entry range (sell zone): $1,475.09 – $1,537.26
- Exit target 1: $1,263.68 (reward/risk 1.5)
- Exit target 2: $1,052.27 (reward/risk 3.0)
- Stop loss: $1,616.03
The verdict is invalidated if the price rises above $1,616.03. The oversold Stochastic reading of 3.3 is the main risk to the call, because a sharp rebound could arrive first.
In plain terms: the stock's chart is weak and still trending down despite strong quarterly revenue, and this technical read stays negative through its validity date of December 11, 2026.
Disclaimer: This technical analysis is generated automatically from exchange data and indicators calculated by JournalArta, for information and education only. The verdict and the entry, target and stop-loss levels are not investment advice or a solicitation to buy or sell any security. Investment decisions and their risks rest solely with the reader.