LLY Stock Gains 3.90%, Testing Key Resistance In Focus
On Agustus 11, 2026: price 1,231.94 USD, trend sideways, RSI 60.9, support 1,115.68, resistance 1,231.94. technical analysis of lly stock.

Eli Lilly shares rose to 1,231.94 USD on the NYSE, up 3.90% in the latest session and now pressing against the top of their recent trading band, according to data from Yahoo Finance as of 10 August 2026 20:30 WIB. The move is notable not just for the size of the gain, but because the stock has climbed to 100% of its 20-day range and is sitting just under the Bollinger upper band at 1,232.52, a setup that often signals momentum is strong but also increasingly stretched.
Trend & Price Action
The broader pattern is still best described as sideways, even after the latest surge, because the SMA20 at 1,173.66 is only modestly above the SMA50 at 1,159.65 and the 20-day slope is negative at -0.61% over five days. That matters: a sideways trend with a slightly falling short-term average usually means the market has not fully committed to a sustained directional break, even if the price is temporarily above both moving averages.
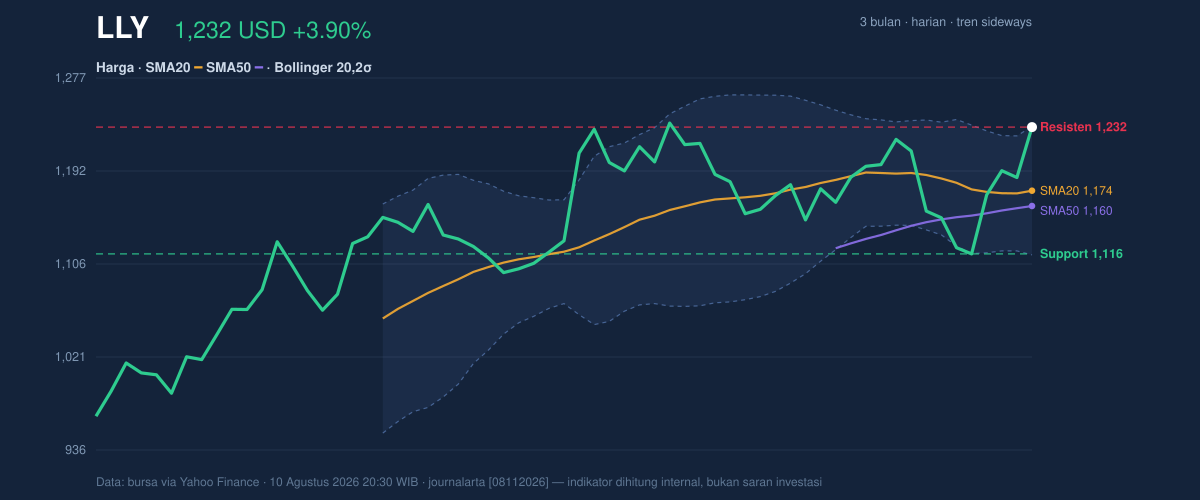
What makes this session more interesting is that price is now trading above the SMA20 after spending time closer to the middle of the band. In plain terms, that says buyers have recently gained control of the tape. But the fact that there is no fresh MA cross means the longer-term trend signal has not yet flipped into a cleaner bullish structure; the market is improving, not fully resolved.
The stock is also only a few dollars below its 3-month high of 1,249.45, which tells readers the latest move is happening near the upper edge of the recent range rather than from a deeply discounted base. That is often where momentum traders show up, but it is also where profit-taking tends to appear.
Oscillators & Momentum
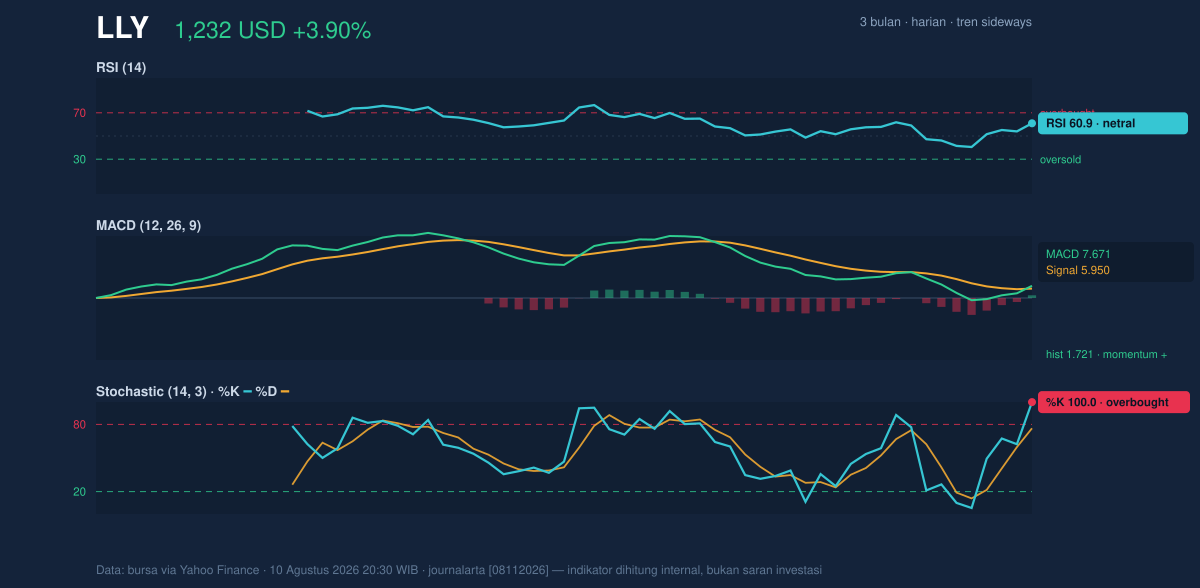
The oscillator picture is mixed, and that mix is the key to understanding the chart. RSI at 60.9 is still in neutral territory, which means the stock is not yet in a classic overbought condition by RSI standards. But the Stochastic %K at 100.0 versus %D at 76.6 is a much hotter reading. Stochastic measures where the current price sits within its recent range, and a reading pinned at the top suggests the stock has moved very near the ceiling of its short-term channel.
That is where the nuance matters. A strong stochastic reading does not automatically mean reversal; it often means the stock is powerful enough to stay elevated. But when it is paired with a trend that is still labeled sideways, it can also mean the move is running ahead of the broader structure. In other words, momentum is positive, but it is not yet fully backed by trend confirmation.
The MACD at 7.671 above its signal line at 5.950, with a positive histogram of 1.721, is the cleanest bullish element in the setup. MACD turning positive means near-term price acceleration is exceeding its recent average pace. That is a sign of participation, not just a one-day pop. Still, MACD works best when it is aligned with expanding trend structure, and here it is advancing inside a broader sideways pattern, which keeps the signal constructive rather than decisive.
Volatility & Volume
Volatility is not flashing panic. The ATR at 42.07, or 3.4% of price, indicates movement is active but not extreme. That matters because a stock near resistance with moderate ATR can either break cleanly or stall without a violent reversal. The Bollinger band width of 10.0% is described as normal, so this is not a squeeze setup where a big move is being tightly compressed; instead, the stock is already near the upper boundary of a standard range.
Volume adds a subtle warning. The latest volume of 3,009,600 is only about 1.1x normal, which shows the rally is being confirmed by participation, but not by an exceptional surge in trading activity. More importantly, OBV is down. On-balance volume is a cumulative measure of whether volume tends to accompany rising or falling prices, so a declining OBV while price is rising can hint that the move is not yet fully supported by broad accumulation. That divergence does not cancel the rally, but it does make the breakout attempt less convincing.
Key Levels & Scenarios
The immediate line in the sand is clear: resistance at 1,231.94 is being tested right now, and the next visible ceiling is the 3-month high at 1,249.45. On the downside, the nearest structural support is 1,115.68, which also sits close to the lower Bollinger band at 1,114.80. That pairing is useful because it shows where the market previously found demand and where the statistical lower edge of the range now sits.
If price can hold above the current band top and move through 1,249.45, the chart would shift from a range-bound recovery into a more meaningful breakout attempt. If it fails to hold above 1,231.94, the more likely outcome is a pause or pullback toward the SMA20 at 1,173.66, where the market would be forced to prove whether this was a real trend change or just an overextended push.
Technical Verdict: HOLD (wait & see)
The setup is constructive, but not clean enough to call fully directional. MACD is positive, price is above the SMA20 and SMA50, and the stock is pressing the top of its recent range. At the same time, Stochastic is overbought, OBV is down, and the broader trend is still labeled sideways, which argues for caution rather than chasing strength.
- Ideal Entry Range: 1,173.66 to 1,159.65, where the price would revisit the SMA20/SMA50 zone and offer a cleaner test of support.
- Exit Target: 1,249.45, the 3-month high and next visible resistance.
- Stop Loss protection: 1,115.68, the 20-hour support and lower Bollinger-area floor.
- Verdict invalidated if price breaks below 1,115.68, because that would weaken the current range structure and reopen downside toward a deeper reset.
For non-traders, this means the stock is strong right now, but it still needs proof that the strength is durable rather than just stretched.
Summary Data LLY
| Last price | 1,231.94 USD |
| Change 1 day / 5 days / 1 month | 3.90% / 9.86% / 4.24% |
| Trend / MA-cross | sideways / none |
| SMA20 / SMA50 | 1,173.66 / 1,159.65 |
| RSI (14) / Stochastic %K | 60.9 / 100.0 |
| Bollinger %B / ATR | 100% / 42.07 |
| Support / Resistance 20 days | 1,115.68 / 1,231.94 |
| Data as of | 10 Agustus 2026 20:30 WIB |


