PANW Stock Gains 5.82%, RSI Overbought In Focus
On Agustus 11, 2026: price 385.04 USD, trend uptrend, RSI 70.4, support 314.15, resistance 385.04. technical analysis of panw stock. PANW Stock Gains — full…

Palo Alto Networks climbed to 385.04 on NASDAQ, up 5.82% from the previous close of 363.86, and the move matters because it pushed the stock to the very top of its recent range, just shy of the 3-month high of 385.17. That is not just a headline gain; it is a signal that buyers have been willing to pay up aggressively, even as momentum indicators begin to warn that the move is getting stretched.
Trend & Price Action
The stock remains in a clear uptrend, helped by a rising SMA20 at 344.38 and a higher SMA50 at 318.50. In plain English, the short-term trend is still above the medium-term trend, which is the sort of alignment technicians like to see in a healthy advance. There is no new MA-cross, so the current move is being carried by price strength rather than a fresh moving-average signal.
What stands out on the chart is how extended the price has become. The stock is trading above the upper Bollinger Band at 382.40, with %B at 103%. That means price is not merely near the top of its recent statistical range; it is trading beyond it. As shown in the chart, that usually reflects strong demand, but it can also mean the stock is running ahead of itself and may need time to cool off. The 20-day Bollinger band width of 22.1% is also expanding, which tells readers volatility is rising rather than settling. In a stock like PANW, that often means larger daily swings can continue.
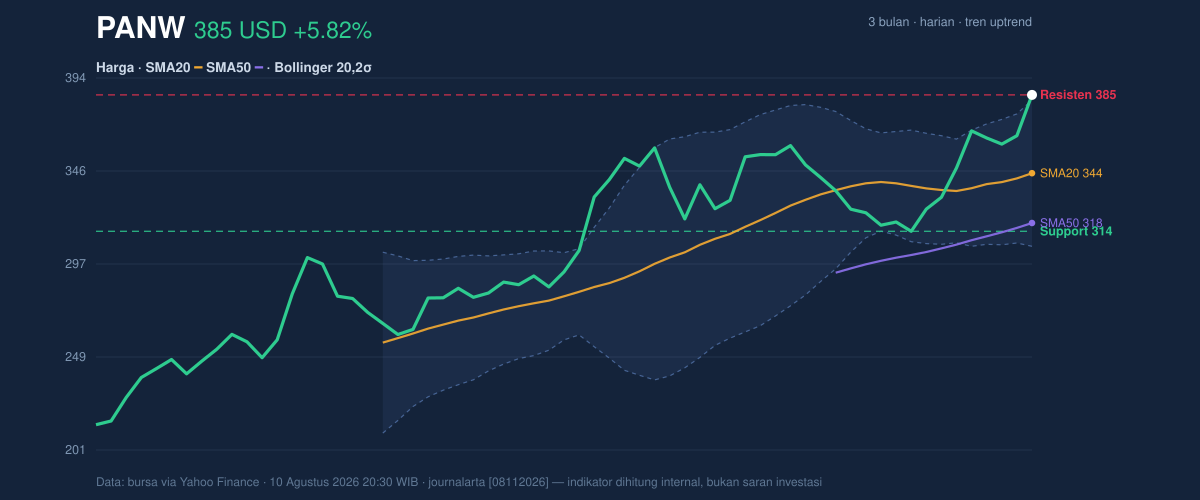
The 20-hour range data is equally telling: support at 314.15 and resistance at 385.04 show the stock finishing at the very top of its short-term band. When price closes at the ceiling of its range, it signals strong control by buyers, but it also leaves less room for immediate upside before the market has to prove it can absorb another leg higher. The 3-month high of 385.17 is the next obvious reference point; the stock is effectively testing that line now.
Oscillators & Momentum
Momentum is strong, but it is also flashing caution. The RSI(14) at 70.4 is in overbought territory, which means the recent advance has been fast enough that the stock may be vulnerable to pauses or pullbacks. Overbought does not mean a reversal is automatic; it means the market has already done a lot of buying in a short time. The Stochastic %K at 99.8 and %D at 85.0 reinforce that message even more sharply: the stock is pressing near the top of its recent momentum range.
At the same time, the MACD at 13.485 remains above the signal line at 10.310, with a positive histogram of 3.175. That is the cleanest sign that trend momentum is still intact. In other words, the stock is overbought, but it is not yet losing trend confirmation. This combination often appears late in a strong run: momentum stays positive while oscillators warn that the move is extended.
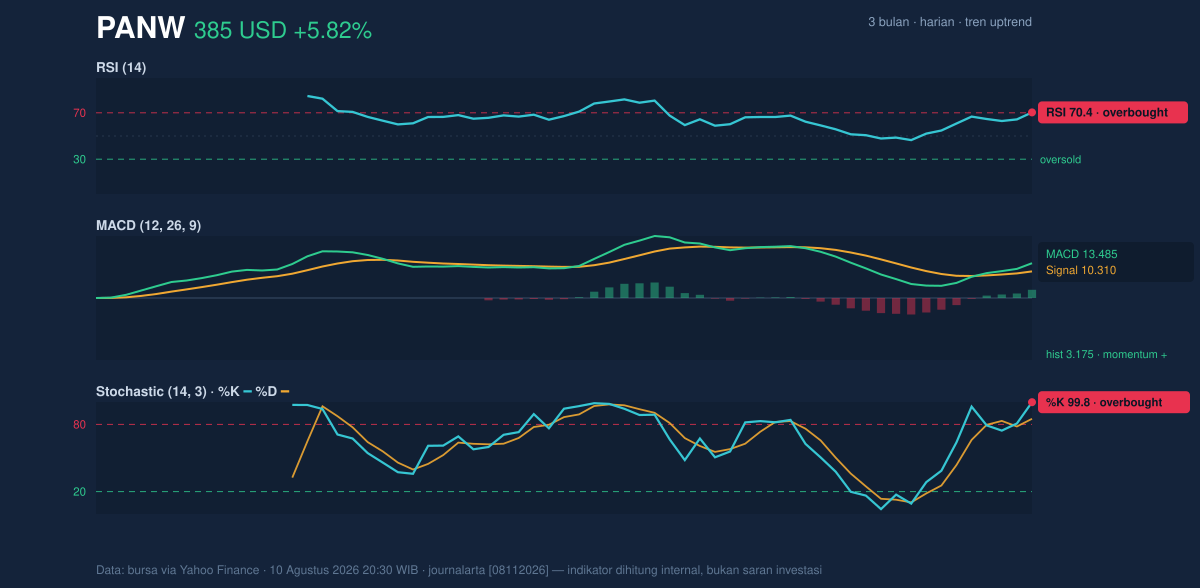
The signal to watch is whether these indicators begin to diverge from price. If RSI and Stochastic stay pinned while price stalls below the high, the market may be preparing for consolidation rather than immediate continuation. If MACD starts to narrow while price fails to make a clean new high, that would be a stronger caution flag. For now, the chart still shows momentum aligned with the trend, but stretched.
Volatility & Volume
Volatility is not just elevated; it is actively expanding. The ATR(14) at 14.86, equal to 3.9% of price, suggests the stock can move materially in either direction over a short period. That matters because a high-ATR stock near resistance can swing quickly once the market decides whether to extend the trend or lock in gains.
Volume gives a more nuanced picture. The latest turnover of 5,822,200 was below the 20-day average of 6,174,650, or about 0.9x normal. So while the price is making a strong push, it is not doing so on unusually heavy participation. That does not negate the move, but it does suggest the breakout-style advance is not yet backed by a surge in trading activity. The OBV is rising, which is constructive because on-balance volume tracks whether volume is accumulating over time. Rising OBV says buyers have generally been in control, even if the latest session was not an outright volume burst.
Key Levels & Scenarios
The market’s immediate question is whether PANW can hold above the upper end of its band and convert resistance into support. The nearest technical floor is the upper Bollinger Band at 382.40, followed by the 20-day SMA at 344.38. Below that, the broader trend would start to lose some of its short-term momentum structure. The more distant downside reference is the 20-hour support at 314.15, which marks the lower edge of the recent short-term trading range.
On the upside, the stock is already pressing against the 3-month high of 385.17. A decisive move beyond that level would show the market is willing to continue paying new highs rather than merely testing them. Failure to clear it cleanly could invite a pause, especially given the overbought oscillator readings.
Technical Verdict: HOLD (wait & see)
HOLD (wait & see) fits the chart best because the trend is still positive, but the stock is also stretched and sitting at resistance.
- MACD remains positive, with the line above signal and a positive histogram, so trend momentum is still intact.
- RSI at 70.4 and Stochastic at 99.8/85.0 show the move is overbought, raising the odds of consolidation.
- Price above the upper Bollinger Band at 382.40 signals strength, but also suggests the stock is extended relative to its recent range.
Verdict invalidated if price breaks/falls below 314.15.
- Ideal Entry Range: 382.40 to 385.17 on confirmation above the recent high, or on a pullback that holds above 344.38
- Exit Target: 385.17 first, then continuation beyond that level only if the breakout is confirmed
- Stop Loss protection: 314.15
In plain English: the stock is strong, but it is also tired enough that traders may want to wait for the next clean signal rather than chase it here.
“It is powerful, but it is stretched,” as the chart suggests, and the next move will show whether PANW is building a higher platform or simply pausing after a fast climb.
Summary Data PANW
| Last price | 385.04 USD |
| Change 1 day / 5 days / 1 month | 5.82% / 10.92% / 16.57% |
| Trend / MA-cross | uptrend / none |
| SMA20 / SMA50 | 344.38 / 318.50 |
| RSI (14) / Stochastic %K | 70.4 / 99.8 |
| Bollinger %B / ATR | 103% / 14.86 |
| Support / Resistance 20 days | 314.15 / 385.04 |
| Data as of | 10 Agustus 2026 20:30 WIB |


