CVX Stock Analysis: Gains 0.90%, Testing Key Resistance
On Agustus 12, 2026: price 196.66 USD, trend uptrend, RSI 61.2, support 181.60, resistance 196.83. technical analysis of cvx stock. CVX Stock Analysis — full…

Chevron’s shares rose to 196.66 USD on the NYSE, up 0.90% from the previous close of 194.91, and the move leaves the stock pressing against the top of its near-term range, according to pricing data from Yahoo Finance. The signal is not just that the stock is higher; it is that buyers have pushed CVX to within striking distance of resistance while the broader trend remains constructive. That combination usually matters more than the daily gain itself.
Trend & Price Action
CVX is still in an uptrend, with the SMA20 at 190.59 rising at 1.69% over 5 days and the share price holding above both the SMA20 and the SMA50 at 183.37. In plain language, the short-term average is above the longer-term average, and price is above both, which tells traders the recent move has not been a one-day spike but part of a broader climb. There is no fresh MA-cross, so the market is not flashing a new regime change; instead, it is extending an existing one.
The stock is also sitting near the upper edge of its recent range, with a 3-month high of 198.87 and a 3-month low of 164.78. That matters because price near the top of the range often means the market has already repriced a good portion of the near-term optimism. As shown in the chart, the latest close is only a step below the visible ceiling.
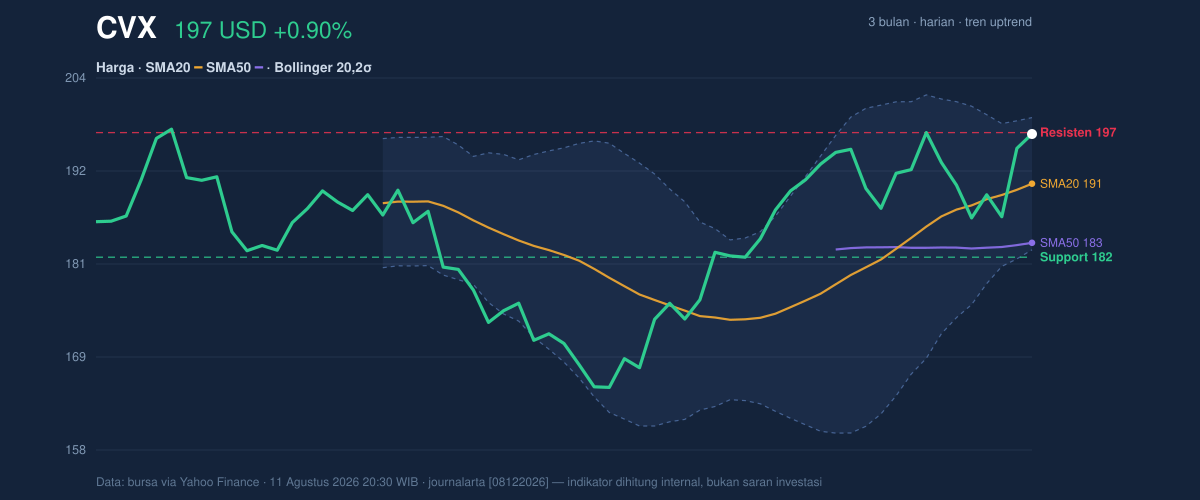
One more detail sharpens the picture: the 20-hour resistance at 196.83 is effectively being tested, while the 20-hour support at 181.60 remains well below. Price is at 99% of the range, which signals strength, but also leaves less room for complacency.
Oscillators & Momentum
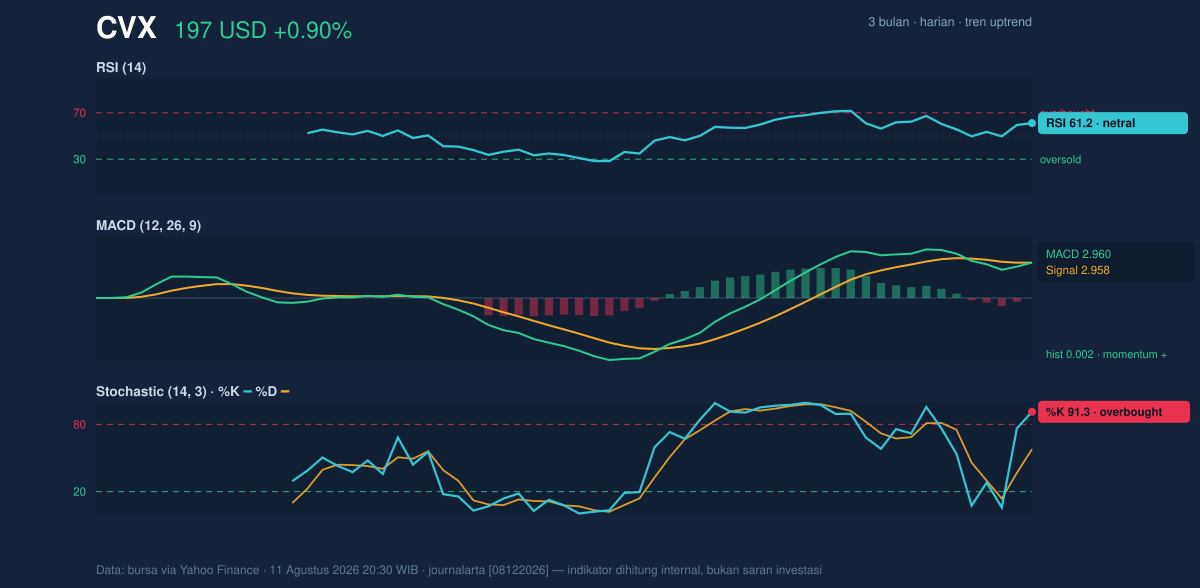
The momentum tools are telling a more nuanced story. The RSI at 61.2 is still in a neutral zone, which means the stock is not yet in a classic overheated condition on that measure. But the Stochastic %K at 91.3 versus %D at 57.9 is overbought, showing that CVX has moved quickly enough to stretch short-term momentum. In practical terms, stochastic often reacts faster than RSI, so this reading suggests the rally may be mature even if it has not fully exhausted itself.
The MACD at 2.960, just above the signal line at 2.958, with a tiny positive histogram of 0.002, still points to positive momentum. That spread is narrow, though, which means the bullish impulse is present but not especially forceful. Strong trends usually show a cleaner gap between MACD and signal; here, the market is advancing, but it is doing so without much acceleration.
That is the key tension in the chart.
Volatility & Volume
Volatility appears contained rather than explosive. The Bollinger Bands show an upper band at 198.66, a middle band at 190.59, and a lower band at 182.51, with %B at 88% and band width at 8.5%, described as normal. A high %B means price is trading near the upper band, which often reflects strength, but it can also mean the move is extended relative to its recent average. Because the bands are not unusually wide, the market has not entered a volatility expansion phase that would typically support a decisive breakout without fresh participation.
Volume adds another caution flag. The latest volume was 6,046,100, below the 20-day average of 7,818,450, or 0.8× normal. That tells us the move higher is not being backed by unusually heavy trading. In technical analysis, rising price on lighter volume can still work, but it is less convincing than a rally powered by broad participation. The OBV is rising, though, which means cumulative volume flow still favors the bulls even if the latest session was not especially busy.
Key Levels & Scenarios
The market is now focused on a narrow band of decision points. The first line to watch is the 196.83 resistance, which sits just above the last price. A clean move through that zone would put the stock into open air toward the 198.66 Bollinger upper band and then the 3-month high at 198.87. If price cannot clear that area, the stock may simply remain capped near the top of its range.
On the downside, the nearest structural floor is the 190.59 SMA20, which doubles as the Bollinger middle band and is therefore an important pivot. Below that, the more meaningful support is 182.51 at the lower Bollinger band, with the broader 181.60 support just beneath it. A drop through that zone would weaken the case that the current trend is still intact.
CVX is bullish on trend, but stretched on short-term momentum, so the chart favors strength with caution rather than a clean breakout signal.
Technical Verdict: HOLD (wait & see)
HOLD (wait & see)
- Trend support: Price is above the SMA20 at 190.59 and SMA50 at 183.37, confirming the uptrend.
- Momentum caution: Stochastic is overbought at 91.3, while RSI at 61.2 is still neutral and MACD is only marginally positive.
- Participation check: Volume is 0.8× normal, so the move has not yet shown strong confirmation from trading activity.
- Verdict invalidated if price falls below 181.60, which would break the key support zone and weaken the current trend structure.
- Ideal Entry Range: 190.59–196.83
- Exit Target: 198.66–198.87
- Stop Loss protection: 181.60 to 182.51
In plain English: Chevron is still trending higher, but it is close enough to resistance and short-term overbought conditions that the chart is asking for confirmation rather than urgency.
The next chart-level test is whether CVX can finish above 196.83 and hold that ground into the session that follows.
Summary Data CVX
| Last price | 196.66 USD |
| Change 1 day / 5 days / 1 month | 0.90% / 3.29% / 8.20% |
| Trend / MA-cross | uptrend / none |
| SMA20 / SMA50 | 190.59 / 183.37 |
| RSI (14) / Stochastic %K | 61.2 / 91.3 |
| Bollinger %B / ATR | 88% / 5.02 |
| Support / Resistance 20 days | 181.60 / 196.83 |
| Data as of | 11 Agustus 2026 20:30 WIB |


