CVX Testing Key Resistance: Stock Gains 1.16% (Agustus 17, 2026)
On Agustus 17, 2026: price 200.00 USD, trend uptrend, RSI 64.4, support 186.41, resistance 200.00. technical analysis of cvx stock. CVX Testing Key Resistance…

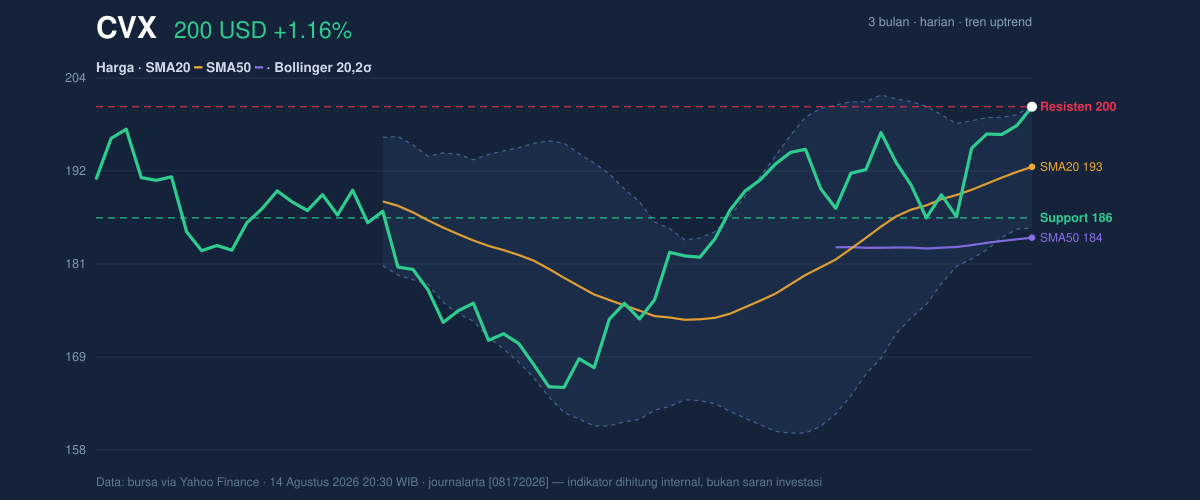
Chevron’s shares on the NYSE closed at 200.00 USD, up 1.16% on the day, after extending a move that has lifted the stock 7.20% over 5 days and 6.73% over 1 month, according to Yahoo Finance data cited at 14 August 2026 20:30 WIB. That push has taken CVX to the top of its near-term trading range, with the price now sitting at 100% of the 20-day range and brushing the upper Bollinger band at 200.13. In plain terms, the market is no longer debating whether the trend is improving; it is testing how much further that improvement can stretch before momentum needs to cool.
Trend & Price Action
The broader structure remains constructive. Chevron is trading above its SMA20 at 192.66 and well above its SMA50 at 183.99, which tells us the shorter trend is still leading the longer one. The uptrend label is backed by the SMA20’s 1.83% rise over 5 days, a sign that the average price itself is climbing rather than merely being crossed by a one-day spike. There is no new MA-cross, so this is not a fresh moving-average signal; instead, it is a continuation pattern, where the market is pressing higher inside an already improving structure.
That matters because continuation moves often look strongest just before they become crowded.
The chart, as shown in the price action panel, also places Chevron just beneath the 3-month high of 201.63, with the nearest support at 186.41. The distance between those levels is meaningful: the stock is trading near the top of its recent range, which usually signals confidence, but also leaves less room for error if buyers pause.
Oscillators & Momentum
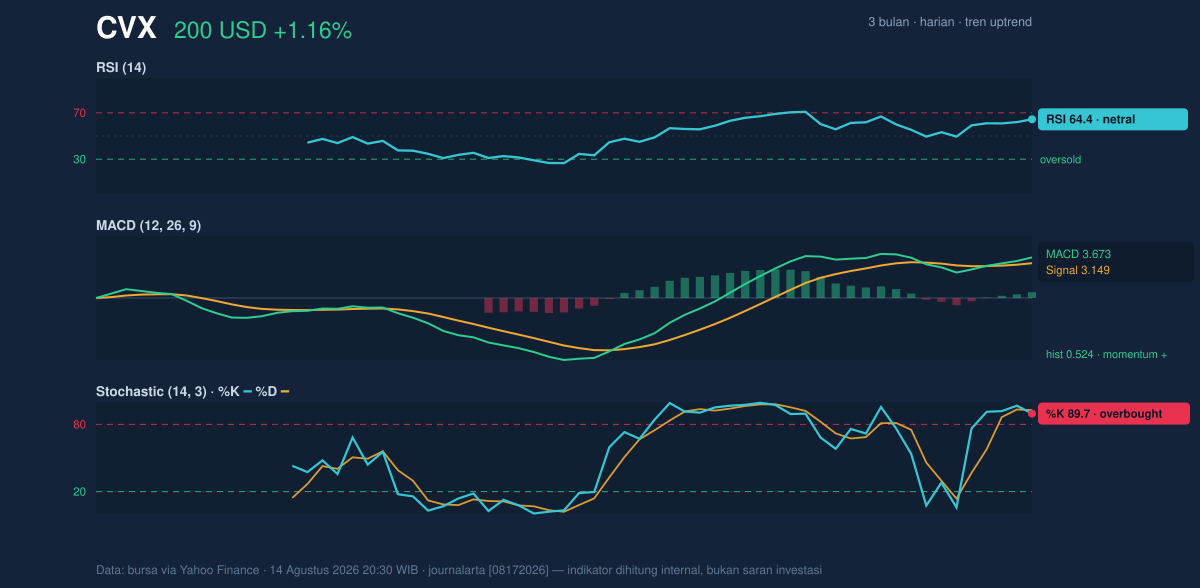
Momentum is positive, but not cleanly one-directional. The RSI at 64.4 sits in neutral territory, which means the stock is not yet in a classic overbought condition by that measure. However, the Stochastic readings of 89.7 and 92.8 are firmly overbought, and that is a different message: short-term price action has accelerated faster than the broader trend gauge. When Stochastic is this elevated while RSI is still short of the overbought zone, it often signals that the move is strong but potentially stretched in the near term.
The MACD at 3.673, above its signal line at 3.149, keeps the directional bias positive. The 0.524 histogram shows the gap between those lines is still open, which means bullish momentum remains intact rather than fading outright. Put simply, the trend is still supported, but the faster oscillator is warning that the stock may need either a pause or a fresh burst of buying to keep advancing cleanly.
As shown in the momentum chart, the message is mixed: trend-following indicators remain constructive, while the faster oscillator is already flashing caution.
Volatility & Volume
Bollinger Bands add an important layer to the story. With the upper band at 200.13, the stock is effectively trading at the ceiling of its current volatility envelope, and the %B reading of 99% says price is almost fully pressing against that boundary. That is not a bearish signal by itself, but it does mean the market is very extended relative to its recent average. The 7.8% band width is also described as a squeeze, which usually implies compressed volatility and the possibility of a larger move once price escapes the range. In other words, Chevron is at a technical inflection point: it is stretched, but the squeeze suggests the next move could still be decisive.
Average participation is not giving a strong warning either. Volume of 7,907,500 is almost exactly in line with the 20-day average of 7,878,685, or about 1.0× normal. That means the latest advance is being accepted by the market, but not yet backed by a clear surge in turnover. The one caution is that OBV is down, which suggests cumulative volume flow has not fully confirmed the price strength. When price rises while OBV weakens, it can imply that not all buyers are participating with conviction.
That is the subtle warning in the tape.
Key Levels & Scenarios
The immediate battleground is straightforward. 200.00 is now both the last price and the 20-day resistance, so the stock is effectively at a decision point. A clean hold above that area would keep the breakout attempt alive and leave the 3-month high at 201.63 as the next visible reference. If the price slips back below the upper band and loses the 192.66 SMA20, the tone would shift from breakout pressure to consolidation. A deeper fade through 186.41 support would weaken the current bullish structure and suggest the recent rally has run ahead of itself.
The key signal is not just where Chevron is trading, but where it is trading relative to the averages and bands that have been guiding it higher.
Technical Verdict: HOLD (wait & see)
HOLD (wait & see)
- MACD remains positive, with the line above signal and a positive histogram, so the broader trend still has upward support.
- Price is above SMA20 and SMA50, confirming the trend structure is intact.
- Stochastic is overbought and %B is at 99%, which argues for caution because the stock is stretched at the top of its recent range.
Verdict invalidated if price falls below 186.41, the 20-day support.
- Ideal Entry Range: 192.66 to 186.41
- Exit Target: 201.63
- Stop Loss protection: below 186.41
For non-traders: Chevron’s chart still looks healthy, but it is already near a short-term ceiling, so the next move matters more than the last one.
Summary Data CVX
| Last price | 200.00 USD |
| Change 1 day / 5 days / 1 month | 1.16% / 7.20% / 6.73% |
| Trend / MA-cross | uptrend / none |
| SMA20 / SMA50 | 192.66 / 183.99 |
| RSI (14) / Stochastic %K | 64.4 / 89.7 |
| Bollinger %B / ATR | 99% / 4.82 |
| Support / Resistance 20 days | 186.41 / 200.00 |
| Data as of | 14 Agustus 2026 20:30 WIB |


