CVX Stock Analysis: Gains 0.94%, Momentum Weakens
On September 29, 2026: price 206.37 USD, trend sideways, RSI 51.3, support 202.41, resistance 217.77. technical analysis of cvx stock. CVX Stock Analysis —…

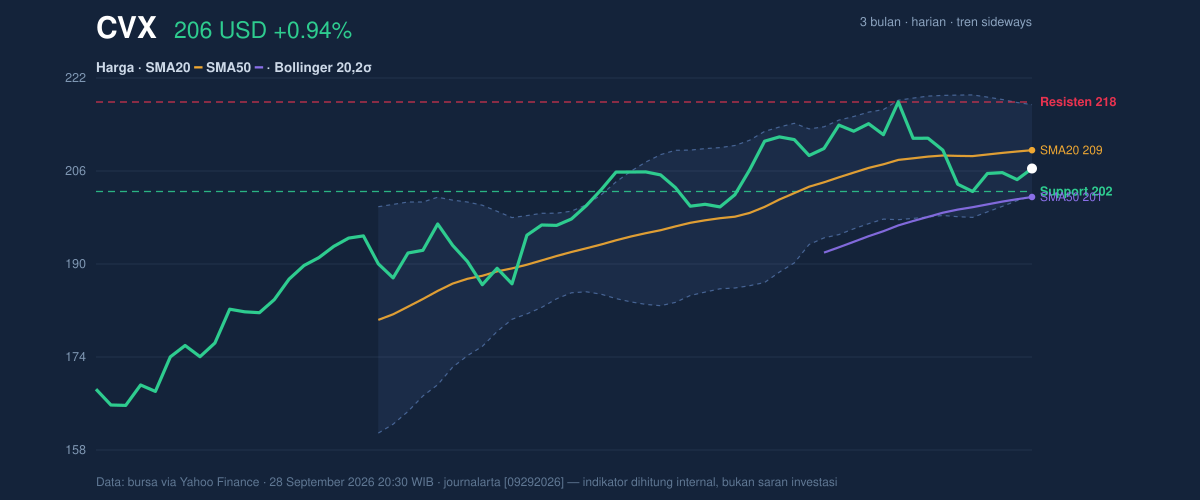
Chevron traded at 206.37 USD on the NYSE, up 0.94% from the prior close of 204.45, but the move still leaves the stock below its 20-day average of 209.50, a sign that the latest rebound has not yet reclaimed the short-term trend line. As shown in the chart, CVX is sitting in a sideways pattern rather than a clean uptrend or downtrend: the price is above the 50-day average at 201.46, yet still under the 20-day average, which usually tells traders the stock is trying to stabilize without fully proving direction. The broader message from the tape is cautious rather than decisive.
Trend & Price Action
The current setup shows a stock that is holding together, but not leading. The sideways trend and the SMA20 slope of 0.47% over 5 days suggest mild upward pressure, yet the fact that price remains below SMA20 means the short-term recovery has not turned into a confirmed breakout. That matters because moving back above the 20-day average often signals that recent buyers have absorbed supply; staying below it implies sellers are still active on rallies.
The absence of a new MA-cross also reinforces the “wait for confirmation” tone. In plain English, there is no fresh signal from the moving averages that a new trend has started. Chevron is trading at roughly 26% of the 20-day range from the low end, which places it closer to support than resistance, but not yet in an oversold panic zone. The 3-month high of 217.78 is just above the current resistance area, which makes the upper band a meaningful test rather than a distant target.
A stock can look firm and still be incomplete. CVX is there.
Oscillators & Momentum
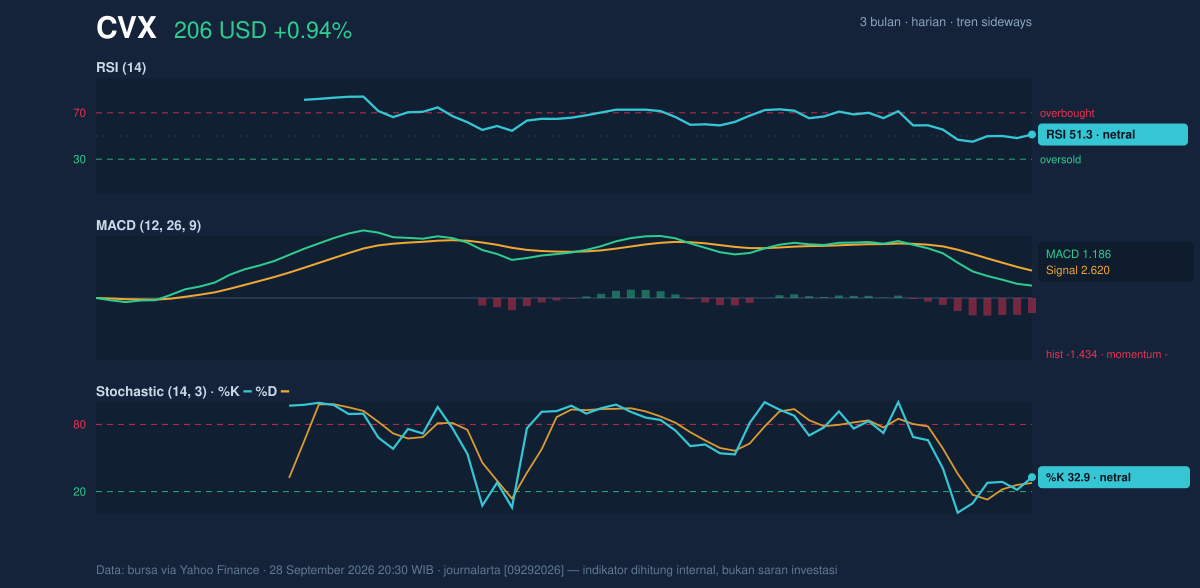
The momentum picture is mixed, which is often what a sideways chart looks like before it chooses a direction. The RSI at 51.3 is neutral, meaning Chevron is neither stretched to the upside nor under obvious selling pressure. That is important because RSI near 50 often reflects equilibrium: neither bulls nor bears have a clear edge. The Stochastic %K at 32.9 and %D at 27.7 are also neutral, but they sit in the lower half of the scale, hinting that short-term momentum is still somewhat soft even if it is not deeply oversold.
The more cautionary signal comes from MACD. With MACD at 1.186 versus a signal line at 2.620, and a histogram of -1.434, the indicator is showing negative momentum. In practical terms, this means the stock may be rising in price day to day, but the underlying push is still weaker than the recent pace that the MACD line was tracking. That kind of divergence often shows up when a rebound is losing energy before it reaches resistance.
So the oscillators are not flashing alarm, but they are not confirming strength either.
Volatility & Volume
Chevron’s Bollinger Bands are narrowing, with a 7.5% band width, which points to a squeeze. That is a technical way of saying the stock has been moving in a tighter corridor and may be building pressure for a larger move. The price sits at %B 30%, which places it in the lower part of the band structure and closer to the lower band at 201.66 than the upper band at 217.34. This positioning does not signal distress, but it does show the stock is not trading near the top of its recent volatility envelope.
ATR adds another layer. The ATR(14) of 4.72, or 2.3% of price, indicates moderate daily movement. That means a normal session can still produce a noticeable swing, but not a disorderly one. Volume, however, is softer than ideal: the latest reading of 9,501,800 compares with a 20-day average of 10,318,220, or about 0.9x normal. When volume runs below average while the stock tests a range, it usually means conviction is lacking. The declining OBV supports that reading, suggesting that recent trading activity has not fully confirmed the price rebound.
Weak volume can make a bounce look better than it is.
Key Levels & Scenarios
The chart’s most important support sits at 202.41, while resistance is marked at 217.77. These levels matter because they frame the current range and help explain where the next decision point lies. If Chevron holds above 202.41 and begins to reclaim 209.50, it would improve the odds that the stock is trying to rotate back toward the upper half of its band structure. If it fails to hold 202.41, the lower Bollinger band at 201.66 becomes the next technical reference, and a break below that would suggest the recent stabilization is fading.
At the upper end, a move through 217.77 would place the stock back near the 3-month high of 217.78, which is a strong signal because it would mean Chevron has absorbed overhead supply and returned to the top of its recent range. Until then, the market is still asking whether this is a base-building phase or just a pause inside a broader range.
Technical Verdict: HOLD (wait & see)
HOLD (wait & see)
- RSI at 51.3 and Stochastic at 32.9 / 27.7 are neutral, so momentum is not strong enough to confirm a breakout.
- MACD histogram at -1.434 is still negative, showing the rebound lacks full momentum confirmation.
- Price below SMA20 at 209.50 while Bollinger bands are squeezing suggests a move may be coming, but direction is not yet confirmed.
Verdict invalidated if price falls below 201.66.
- Ideal Entry Range: 202.41 to 209.50
- Exit Target: 217.77 to 217.78
- Stop Loss protection: below 201.66
In plain English, Chevron is not showing enough technical strength to call the next move with confidence, but it is close enough to key levels that the next break could matter quickly.
The next technical checkpoint is whether CVX can retake 209.50 while volume improves, or whether it slips back toward 202.41 as the squeeze resolves.
Summary Data CVX
| Last price | 206.37 USD |
| Change 1 day / 5 days / 1 month | 0.94% / 1.33% / 2.23% |
| Trend / MA-cross | sideways / none |
| SMA20 / SMA50 | 209.50 / 201.46 |
| RSI (14) / Stochastic %K | 51.3 / 32.9 |
| Bollinger %B / ATR | 30% / 4.72 |
| Support / Resistance 20 days | 202.41 / 217.77 |
| Data as of | 28 September 2026 20:30 WIB |



