HD Stock Gains 1.05% Today, Testing Key Resistance
On Agustus 12, 2026: price 354.48 USD, trend uptrend, RSI 59.6, support 324.71, resistance 355.62. technical analysis of hd stock. HD Stock Gains — full…

Home Depot shares rose to 354.48 USD in New York trading, up 1.05% on the day, according to Yahoo Finance data as of 11 August 2026 20:30 WIB. The move keeps the stock inside a clear short-term uptrend, but the way it is arriving there matters: price is pressing close to the top of its recent range, momentum is positive, and yet participation is lighter than normal. That combination often signals a stock that is still being carried higher, but not with broad conviction.
Trend & Price Action
The chart shows Home Depot trading above both its SMA20 at 340.90 and SMA50 at 335.92, which is the basic definition of an intact uptrend. More importantly, the shorter average is rising at 1.04% over 5 days, so the trend is not just above average; it is still gaining altitude. There is no fresh MA-cross, meaning the market has already completed the main trend shift and is now in the more mature phase where gains tend to depend on whether price can keep holding above support rather than on a new crossover signal.
That matters because the stock is not sitting in the middle of its range. It is trading at 96% of the 20-hour range, with 355.62 acting as near-term resistance and the 3-month high at 358.85 only slightly above that. In plain terms, the market is close to a ceiling. When a stock spends time near the upper edge of its band, it usually means buyers have been persistent — but it also means there is less room before the next test of supply.
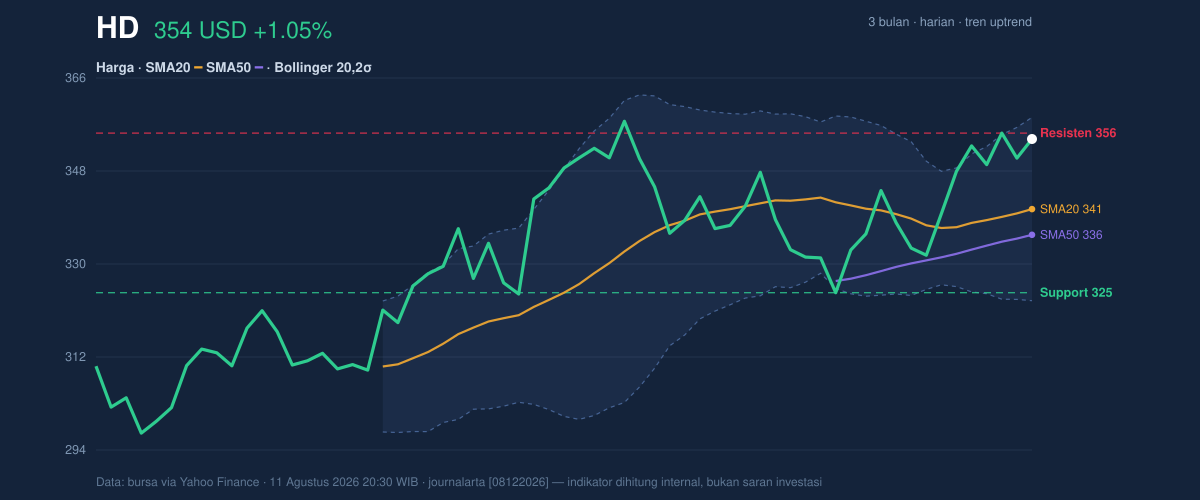
The Bollinger band structure reinforces that reading. Price is near the upper band at 358.65, with %B at 88%, which means the stock is trading in the upper part of its recent volatility envelope. That is not automatically a reversal signal, but it does say the move is extended relative to its own recent average. The band width is 10.4% and described as normal, so this is not a squeeze setup waiting for a dramatic breakout; it is a normal-volatility uptrend already in motion.
A short sentence says it best: the trend is healthy, but the stock is no longer cheap within that trend.
Oscillators & Momentum
The momentum picture is mixed, and that mix is the real story. The RSI at 59.6 is still neutral, which means the stock is not yet in a classic overbought zone on that measure. But the Stochastic %K at 89.0 and %D at 89.2 are both overbought, showing price has been closing near the top of its recent range for long enough to stretch short-term momentum. In practical terms, stochastic is warning that the latest push may be getting tired even if the broader trend remains constructive.
The MACD at 4.562 above its signal line at 2.951, with a positive histogram of 1.612, is the strongest confirmation in the setup. MACD is a trend-following indicator, and when it sits above the signal line with a positive histogram, it tells you the uptrend still has force behind it. So while stochastic is flashing “extended,” MACD is still saying “trend intact.” That divergence is common near resistance: short-term traders may lock in gains, but the larger directional bias has not broken.
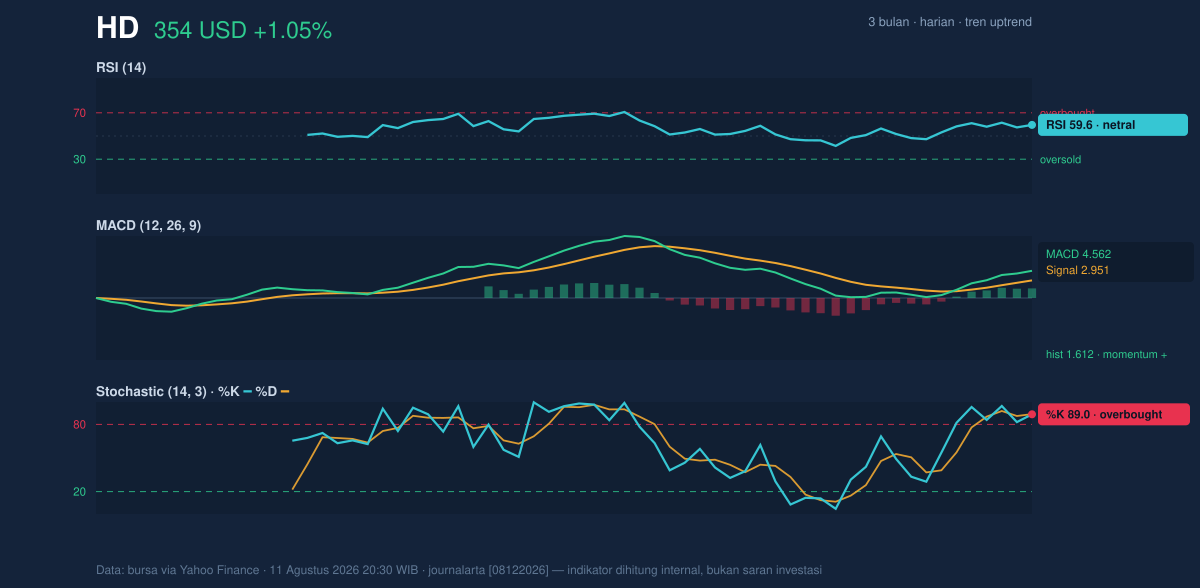
In other words, the oscillators are not aligned perfectly, but they are not contradicting the trend either. RSI is neutral, stochastic is stretched, and MACD remains positive. That usually points to a market that can keep rising, but may do so unevenly.
Volatility & Volume
Volatility is moderate, with ATR(14) at 8.75, or about 2.5% of the share price. ATR measures the typical daily trading range, so this tells readers the stock is not in a wild, high-stress phase. Moves of that size are enough to matter, but not enough to imply panic or disorder.
Volume is the softer spot in the chart. The latest volume of 2,549,700 compares with a 20-day average of 3,807,100, or about 0.7x normal. That means the latest advance is happening on lighter participation than usual. Price can still rise on low volume, but it is less persuasive than a move backed by broad turnover. The OBV is falling, which adds a second caution flag: On-Balance Volume tracks whether volume is flowing into the stock or away from it, and a decline suggests that the recent price strength has not yet been matched by equally strong accumulation.
Put simply: the tape is rising, but the crowd is not fully confirming it.
Key Levels & Scenarios
The most important support level is 324.71, the 20-hour low. That is the line that shows where buyers previously stepped in. As long as price stays above it, the uptrend remains structurally intact. The immediate resistance is 355.62, and above that sits the 3-month high of 358.85. Those two levels define the next test: whether Home Depot can clear the recent ceiling or stall just beneath it.
If the stock pushes through 355.62 and then 358.85, the chart would shift from “testing resistance” to “entering price discovery above the recent range.” If it fails there, the more likely reaction is a pullback toward the 340.90 SMA20, which now acts as the first dynamic support. A break below that average would suggest the short-term trend is losing momentum. A break below 324.71 would be a more serious sign that the current advance has failed.
Technical Verdict: HOLD (wait & see)
The setup is constructive, but not clean enough to call fully decisive. The reason is the tension between positive MACD momentum and overbought stochastic readings, combined with below-average volume and a price that is already pressing near resistance at 355.62. The trend is up, but the market is stretched inside that trend.
- Entry Range: 340.90 to 355.62, with the cleaner area being near 340.90 if price revisits the SMA20.
- Exit Target: 358.85, using the 3-month high as the next visible ceiling.
- Stop Loss: 324.71, below the 20-hour support that marks the recent floor.
- Verdict invalidated if price breaks below 324.71, because that would weaken the current uptrend structure.
For non-traders: the shares are still climbing, but they are close enough to resistance that the next move matters more than the last one.
Summary Data HD
| Last price | 354.48 USD |
| Change 1 day / 5 days / 1 month | 1.05% / 1.79% / 4.96% |
| Trend / MA-cross | uptrend / none |
| SMA20 / SMA50 | 340.90 / 335.92 |
| RSI (14) / Stochastic %K | 59.6 / 89.0 |
| Bollinger %B / ATR | 88% / 8.75 |
| Support / Resistance 20 days | 324.71 / 355.62 |
| Data as of | 11 Agustus 2026 20:30 WIB |


