AMAT Stock Gains 4.29% Today, Momentum Gains
On Agustus 13, 2026: price 548.15 USD, trend sideways, RSI 51.9, support 436.45, resistance 564.55. technical analysis of amat stock. AMAT Stock Gains — full…

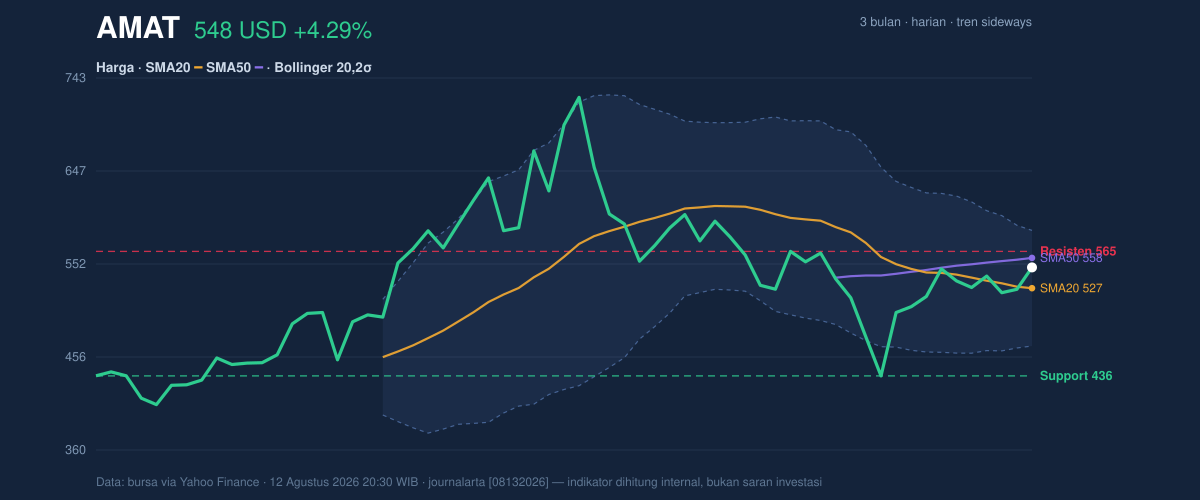
Applied Materials is trading higher after a sharp one-day move, but the chart still shows a market that is trying to stabilize rather than break into a clean trend. As of 12 August 2026, the shares were last at 548.15 USD, up 4.29% on the day, even though the stock remains 5.40% lower over one month and the broader technical picture still reads sideways.
Trend & Price Action
The most important signal is that price is now above the SMA20 at 526.73, which means the stock has recovered its short-term average and is no longer trading below the immediate trend line. That usually matters because moving back above the 20-day average often shows short-term sellers are losing control. But the recovery is not yet strong enough to call a full trend reversal, because the SMA50 sits higher at 557.87, leaving the share price below the medium-term line that often acts like a ceiling in choppy markets.
The chart also shows no fresh MA cross, so there is no new moving-average confirmation to suggest a durable shift in direction. The slope of the SMA20 is still -2.58% over 5 days, which tells readers the short-term trend remains soft even after the latest bounce. In plain language: the stock is rising inside a market that has not fully turned upward.
On the price map, Applied Materials is trading near the upper part of its recent range, with 20-hour support at 436.45 and 20-hour resistance at 564.55. It is also sitting at about 87% of that range, which means the rebound has already done much of the work and is now approaching an area where buying interest often slows.
Oscillators & Momentum
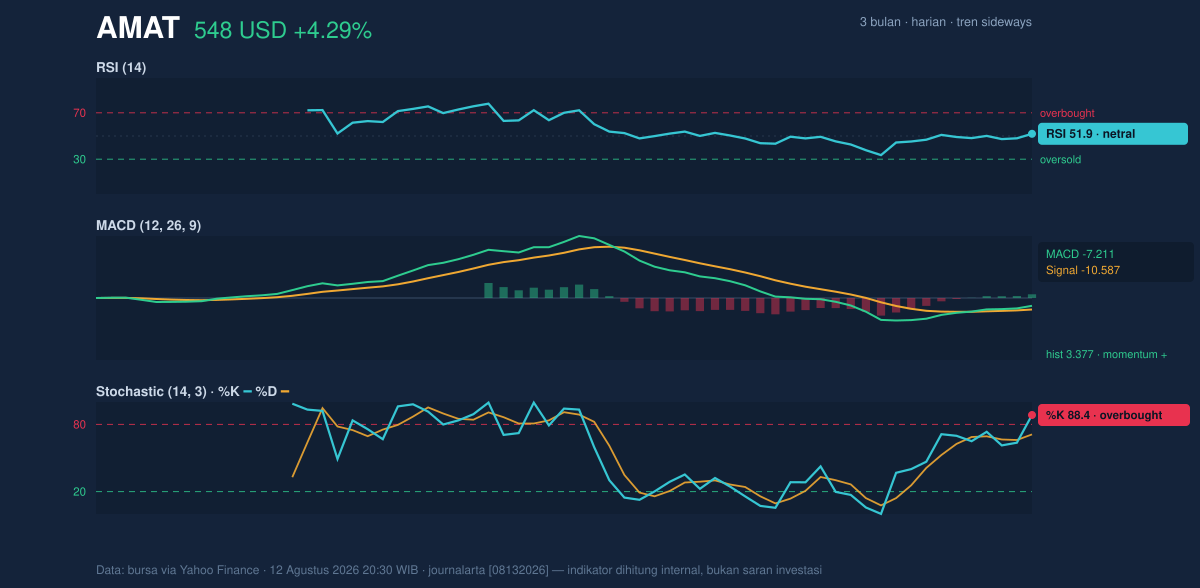
Momentum is mixed, and that is the most useful way to read this stock right now. The RSI at 51.9 is neutral, which usually means neither buyers nor sellers have a decisive edge. That matters because a neutral RSI after a rebound often signals a market that can still move either way, depending on whether follow-through buying appears.
The more aggressive short-term signal comes from stochastic, where %K at 88.4 and %D at 71.1 place the stock in overbought territory. Overbought does not mean the stock must fall immediately; it means the recent climb has been fast enough that the market may need to pause, consolidate, or cool off before it can extend higher. In other words, the rally has momentum, but it is stretched.
MACD is the cleaner bullish element. With MACD at -7.211, signal at -10.587, and a positive histogram of 3.377, the indicator suggests upward momentum is improving even though the broader setup has not fully turned positive. That combination often means the stock is recovering from weakness, but confirmation still depends on whether price can keep holding gains rather than just bouncing briefly.
Volatility & Volume
Volatility is elevated, and that raises the stakes for the next move. The Bollinger Bands show upper band at 586.16, middle band at 526.73, and lower band at 467.30, with %B at 68% and a 22.6% band width. A widening band usually signals a market that is no longer calm; price swings can expand quickly once direction becomes clearer. Since the stock is above the middle band but still below the upper band, the chart suggests recovery, not breakout.
The ATR at 35.29, or 6.4% of price, reinforces that message. ATR measures the average daily trading range, so a high reading means traders should expect wider moves than usual. This is important because a stock can look stable on a closing basis while still being capable of large intraday swings.
Volume was 6,916,400, below the 20-day average of 7,322,665, or about 0.9x normal. That weakens the day’s advance slightly, because price gains are more convincing when they come with heavier participation. Still, OBV is rising, which means the cumulative volume trend is improving and buyers have not disappeared. The message is subtle but important: the move higher is being supported, though not aggressively.
Key Levels & Scenarios
The stock’s position near the top of its recent band makes the next levels especially important. The immediate resistance to watch is 564.55, while the Bollinger upper band at 586.16 marks the next technical ceiling if momentum extends. On the downside, 526.73 is the first important line because it is both the SMA20 and the Bollinger middle band, and 467.30 is the lower band that would matter if the rebound fails.
The broader 3-month range also frames the story. The stock’s 3-month high is 739.67 and the 3-month low is 397.37, showing that Applied Materials remains well inside a wide historical corridor rather than near a fresh breakout zone.
If the shares clear 564.55 and hold above it, the chart would suggest the rebound is gaining real traction. If they slip back below 526.73, the move starts to look more like a short-term bounce inside a sideways market. A break under 467.30 would be a stronger warning that sellers are regaining control.
Technical Verdict: HOLD (wait & see)
The setup is not bearish, but it is not cleanly bullish either. The stock has recovered above the SMA20 at 526.73, MACD is positive on the histogram, and OBV is rising, which all point to improving participation. At the same time, stochastic is overbought, the SMA20 slope is still negative, and the price remains below the SMA50 at 557.87, so the trend has not fully flipped.
- Ideal Entry Range: 526.73 to 548.15, where price is either retesting the short-term average or holding the current rebound zone.
- Exit Target: 564.55 to 586.16, matching the 20-hour resistance and the Bollinger upper band.
- Stop Loss protection: 467.30, the lower Bollinger band and the level that would show the rebound has failed.
- Verdict invalidated if price breaks below 467.30, because that would signal the current recovery has lost technical support.
For non-traders, this means the stock has repaired some short-term damage, but it still needs proof before the move can be trusted. “The market is no longer falling in a straight line — but it has not yet earned the right to call itself strong.”
Summary Data AMAT
| Last price | 548.15 USD |
| Change 1 day / 5 days / 1 month | 4.29% / 2.60% / -5.40% |
| Trend / MA-cross | sideways / none |
| SMA20 / SMA50 | 526.73 / 557.87 |
| RSI (14) / Stochastic %K | 51.9 / 88.4 |
| Bollinger %B / ATR | 68% / 35.29 |
| Support / Resistance 20 days | 436.45 / 564.55 |
| Data as of | 12 Agustus 2026 20:30 WIB |


