JPMorgan Chase ended at 365.18 USD on 12 August 2026, up 0.87% on the day and now sitting just under the Bollinger upper band at 366.66. The stock is pressing the top of its recent range, but the message from the indicators is not uniform: trend remains firm, momentum is positive, and short-term oscillators are already stretched. In plain terms, JPM is still climbing, but it is doing so close to a ceiling that traders are watching closely.
Trend & Price Action
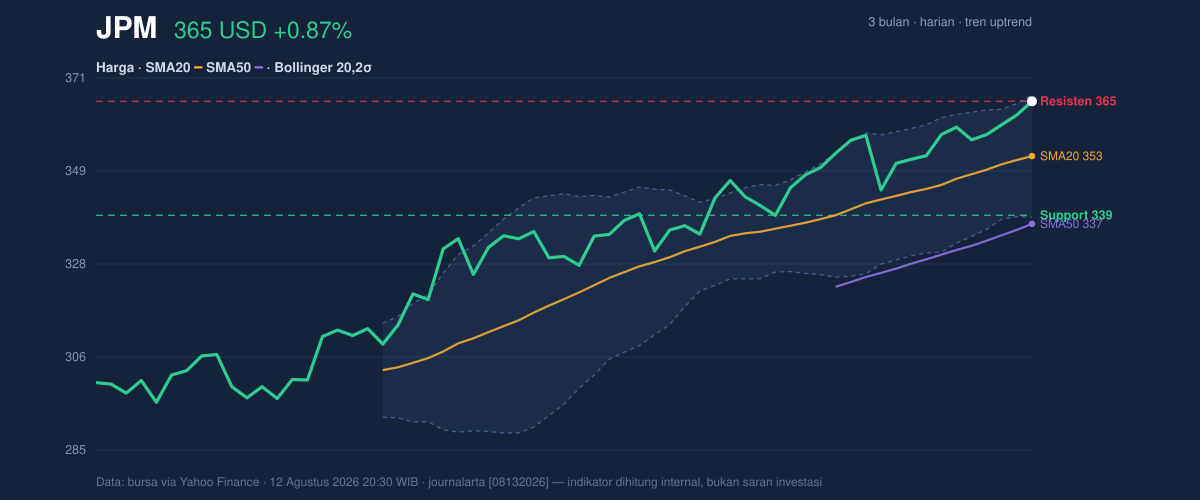
JPM is in an uptrend, and the structure on the chart shows why. The share price is above both the SMA20 at 352.54 and the SMA50 at 336.89, which means the market is trading above both its short- and medium-term averages. That usually signals that buyers have had the upper hand for long enough to lift the trend, not just spark a one-day bounce.
The slope of the SMA20 at 1.51% over 5 days matters because it shows the trend is still rising rather than flattening out. There is no fresh MA-cross, so the chart is not being driven by a new moving-average signal; instead, it is extending an existing trend. As shown in the chart, the price is also at the very top of its 20-hour range, with support at 338.87 and resistance at 365.18. That positioning is important: when price sits at 100% of its recent range, the market has already used much of its near-term upside room unless it can break into new highs.
3-month price action chart of JPM: price, SMA20/50, Bollinger, support & resistance. Data: exchange via Yahoo Finance.
The three-month high at 366.09 is only a fraction above the last price. That makes the current area technically sensitive: a move through that level would signal that the stock is not just holding gains, but attempting a fresh extension beyond its recent peak. Failure to do so would leave JPM trading right below a well-defined ceiling.
Oscillators & Momentum
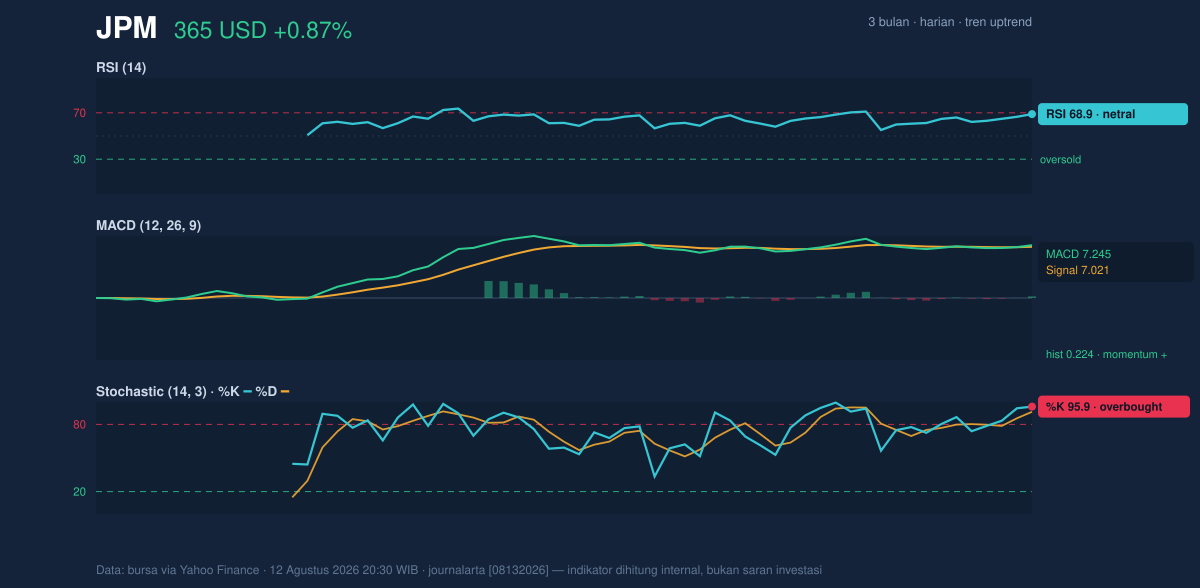
The momentum picture is constructive, but also a bit crowded. As shown in the chart, the MACD at 7.245 is above the signal line at 7.021, with a positive histogram of 0.224. That combination means the trend’s internal momentum is still pointing upward; the faster line remains ahead of the slower one, so the rally has not yet lost its basic directional push.
Momentum chart of JPM: RSI(14), MACD, Stochastic. Data: exchange via Yahoo Finance.
The caution comes from the oscillators. RSI at 68.9 is described here as neutral, but it is close to the classic overbought zone, which tells readers the stock has already done a lot of work without a corresponding reset. The Stochastic %K at 95.9 and %D at 91.2 are more explicit: that is an overbought reading, meaning the stock is closing near the top of its recent trading range and may be vulnerable to a pause or pullback even if the broader trend stays intact. In practical terms, the oscillators are not saying the trend is broken; they are saying the move is mature.
Volatility & Volume
Volatility is not elevated enough to suggest disorder. The ATR(14) at 6.38, equal to 1.7% of price, points to moderate volatility. That means daily swings are still meaningful, but not extreme, so a move through nearby resistance would not require a chaotic market backdrop.
The Bollinger setup is especially useful here. The band width at 8.0% is described as normal, which suggests the stock is not in a squeeze that would usually precede a sharp expansion, nor is it in an unusually wide, unstable phase. More importantly, the %B at 95% shows price is trading very near the top of the band. That is a classic sign of strength, but it also means the stock is stretched relative to its own recent distribution. As shown in the chart, this is the kind of positioning that can either precede a breakout or a short pause while the market digests gains.
Volume offers a softer note. Last volume was 4,365,500, well below the 20-day average of 7,181,445, or 0.6x normal. That matters because a rally near resistance is more convincing when it is backed by heavier participation. Here, the move is being made with less-than-average turnover, which suggests the advance is currently being maintained rather than forcefully confirmed. Still, OBV is rising, which means the broader flow of volume has not turned against the stock; accumulation remains in place even if the latest session was quieter.
Key Levels & Scenarios
The immediate technical map is tight. Resistance at 365.18 is now the first line to watch because the stock finished right on it, while the three-month high at 366.09 sits just above as the next obvious test. On the downside, support at 338.87 lines up near the lower part of the recent range and remains the main floor for the current structure.
If JPM clears the 366.09 area, the chart would be signaling continuation beyond the recent ceiling, with the upper Bollinger band at 366.66 acting as the nearby technical reference. If it fails to hold above the current range and starts slipping, the first meaningful check is whether price can stay above 352.54, the SMA20 and Bollinger middle band. A loss of that level would suggest the market is no longer simply pausing near highs, but beginning to unwind some of the recent advance.
Technical Verdict: HOLD (wait & see)
- Trend is still positive: price is above the SMA20 at 352.54 and SMA50 at 336.89, with the SMA20 slope rising.
- Momentum is strong but extended: MACD is positive, while Stochastic is overbought and RSI is near the upper end of its range.
- Price is pressing resistance: the stock closed at 365.18, just below the 3-month high of 366.09 and near the Bollinger upper band at 366.66.
- Verdict invalidated if price falls below 338.87, the stated support and lower boundary of the current range.
- Ideal Entry Range:352.54 to 338.87
- Exit Target:366.09 to 366.66
- Stop Loss protection:below 338.87
That means JPM is still technically strong, but it is already close to the point where momentum needs fresh confirmation rather than just momentum alone.