JPM Stock Gains 0.68%, Testing Support Level In Focus
On September 22, 2026: price 352.04 USD, trend sideways, RSI 47.9, support 348.92, resistance 362.06. technical analysis of jpm stock. JPM Stock Gains — full…

JPMorgan Chase fell to 352.04 USD on NYSE, a modest 0.68% gain on the day, but the more important signal is where the stock sits: still below its short-term averages and inside a tightening range. That combination matters because it says the market is not trending strongly in either direction; it is waiting for a catalyst to resolve the squeeze shown on the chart.
Trend & Price Action
As shown in the chart, JPM is trading below its SMA20 at 354.49 and just under the SMA50 at 353.51, with no fresh moving-average crossover. In plain terms, the stock has not yet reclaimed the short-term trend, even though it is close enough to those averages that a small move could change the tone quickly. The broader setup remains sideways, and the SMA20 slope of -0.45% over 5 days suggests the recent drift has been slightly lower rather than building a clean recovery.
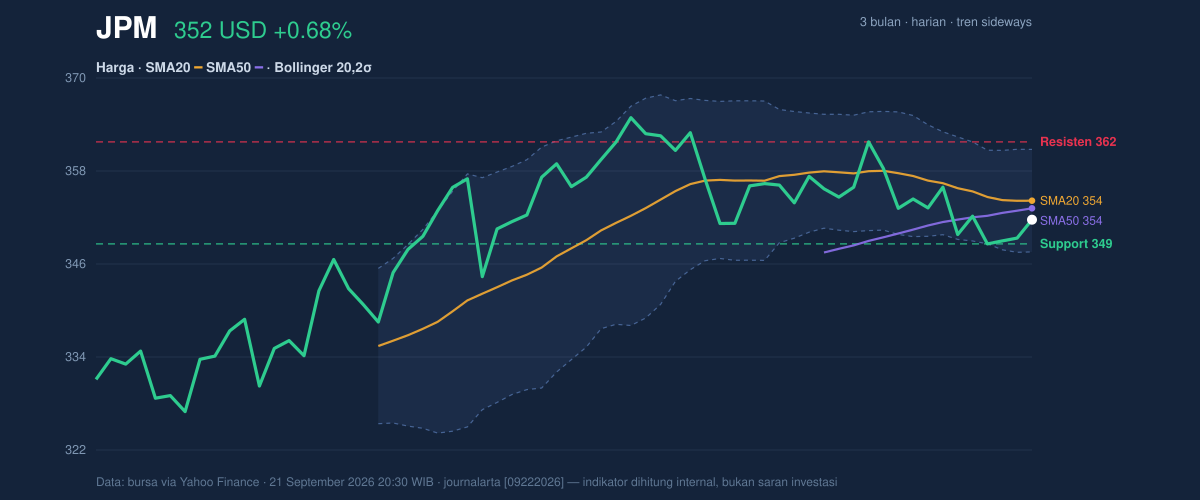
The Bollinger Bands add an important layer. Price is sitting near the middle of the band structure, with %B at 31%, which means JPM is positioned in the lower half of its recent volatility envelope but not at an extreme. More importantly, the 3.7% band width shows the bands have narrowed. That is the market’s way of saying volatility has compressed; when that happens, the next move often comes with more force than the recent day-to-day drift suggests. The stock is also only 24% of the way through its 20-day range, which reinforces the idea that it is not stretched toward resistance and still has room to move either way.
Oscillators & Momentum
The momentum indicators are mixed, but not in a bullish way yet. RSI at 47.9 is neutral, meaning the stock is neither overbought nor oversold. That sounds balanced, but in context it also means buyers have not taken control. Stochastic %K at 45.3 and %D at 36.7 are also neutral, with %K above %D, which hints at a short-term lift, but not a strong one.
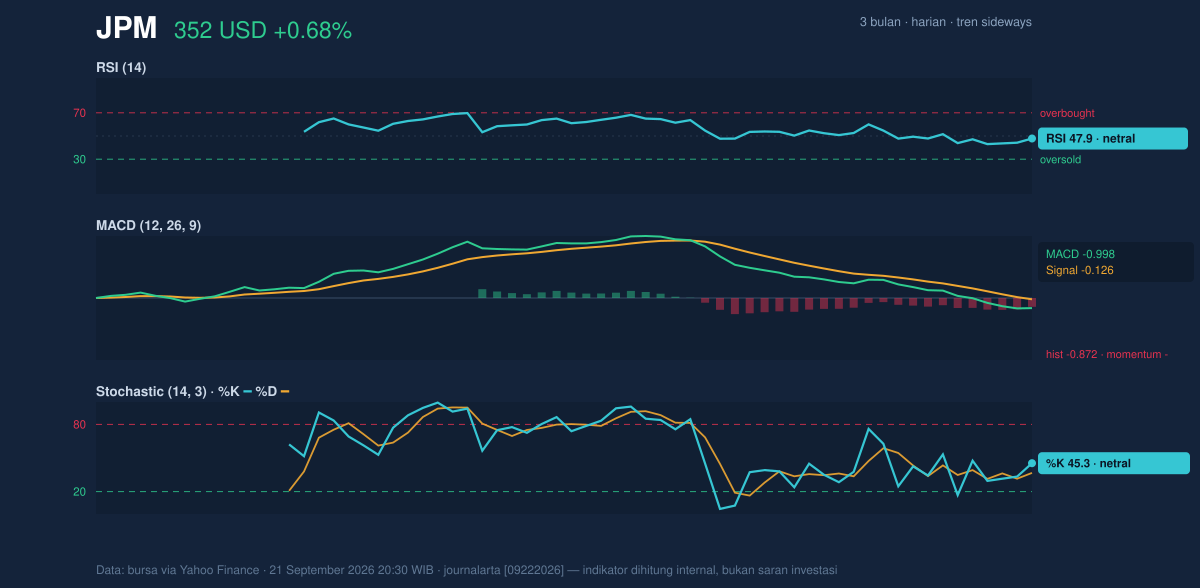
The clearest message comes from MACD. MACD at -0.998, below the signal line at -0.126, with a histogram of -0.872, shows momentum is still negative. For general readers, MACD tracks whether recent price action is strengthening or weakening relative to the longer trend. A negative histogram means the stock is still losing upward traction, even if the decline is not dramatic. That is why the recent bounce has not yet translated into a convincing trend reversal.
Volatility & Volume
The ATR at 7.13, equal to 2.0% of price, points to moderate volatility. That matters because JPM is not behaving like a highly volatile breakout name; its daily swings are contained, but not dull enough to ignore. The narrow Bollinger structure suggests that the next directional move could be sharper than the recent average range.
Volume gives a subtler message. The latest turnover of 6,389,600 shares was below the 20-day average of 6,844,730, or 0.9x normal. That means the day’s move lacked full participation. Price gains are more persuasive when they come with heavier volume, because that shows institutions and larger market participants are involved. Here, the stock rose, but not with strong crowd confirmation. Still, OBV is rising, which is a constructive sign beneath the surface: on-balance volume tracks whether trading pressure is gradually accumulating. In other words, the stock is not being abandoned, even if the latest breakout attempt has not yet attracted forceful demand.
Key Levels & Scenarios
The immediate map is clear. Support sits at 348.92, while resistance is 362.06. That places JPM in the middle of a defined band, with the price currently closer to support than to resistance. The 3-month high at 366.50 is the upper reference point, and the 3-month low at 325.01 marks the deeper downside boundary.
If JPM holds above 348.92 and starts moving back through the 354.49 and 353.51 average zone, the chart would begin to show a more credible recovery from the current sideways pattern. If it fails to hold 348.92, the next signal would be that the squeeze is resolving lower rather than higher, and the recent neutral momentum would give way to a weaker structure.
Technical Verdict: HOLD (wait & see)
HOLD (wait & see) fits the chart because the stock is trapped between neutral oscillators and a still-negative MACD, while price remains below SMA20 and just under SMA50. The squeeze in Bollinger Bands suggests a larger move may be coming, but the direction is not confirmed yet. OBV rising is constructive, but the latest volume was still below average, so the move lacks full conviction.
- Entry Range: 348.92 to 354.49, where support and the SMA20 zone can be tested
- Exit Target: 362.06, with the 366.50 3-month high as the next chart reference if resistance is cleared
- Stop Loss protection: below 348.92, since that would break the nearest support and weaken the current range structure
- Verdict invalidated if price breaks below 348.92
For non-traders: JPM is not showing a clear trend right now, so the chart says to wait for a cleaner move above resistance or below support.
Summary Data JPM
| Last price | 352.04 USD |
| Change 1 day / 5 days / 1 month | 0.68% / 0.55% / 0.13% |
| Trend / MA-cross | sideways / none |
| SMA20 / SMA50 | 354.49 / 353.51 |
| RSI (14) / Stochastic %K | 47.9 / 45.3 |
| Bollinger %B / ATR | 31% / 7.13 |
| Support / Resistance 20 days | 348.92 / 362.06 |
| Data as of | 21 September 2026 20:30 WIB |



