JPM Stock Analysis: Gains 0.34%, Testing Key Resistance
On Agustus 10, 2026: price 357.52 USD, trend uptrend, RSI 63.0, support 334.53, resistance 359.24. technical analysis of jpm stock. JPM Stock Analysis — full…

JPMorgan Chase’s shares rose to 357.52 USD on 7 August 2026, up 0.34% on the day and 6.26% over the past month, with the stock sitting close to the top of its recent trading range. That matters because the move is not just a one-day bounce: JPM is still trading above SMA20 at 349.40 and above SMA50 at 333.00, which keeps the broader structure pointed upward even as short-term momentum starts to look less forceful.
Trend & Price Action
The chart shows a stock that is still being bought on dips, but not aggressively enough to break cleanly into a new phase. JPM’s uptrend is intact, helped by the SMA20 rising at 1.51% over 5 days. That slope signals that the short-term average is still climbing, which usually means the recent price trend has enough strength to attract follow-through buying.
At the same time, there is no fresh moving-average crossover to amplify that message. In plain English, the trend is positive, but it is already established rather than newly ignited. The share price is also trading at 93% of its 20-hour range, with support at 334.53 and resistance at 359.24. That position near the upper end of the range suggests the market has been willing to pay up, but it also leaves less room before the stock runs into overhead supply.
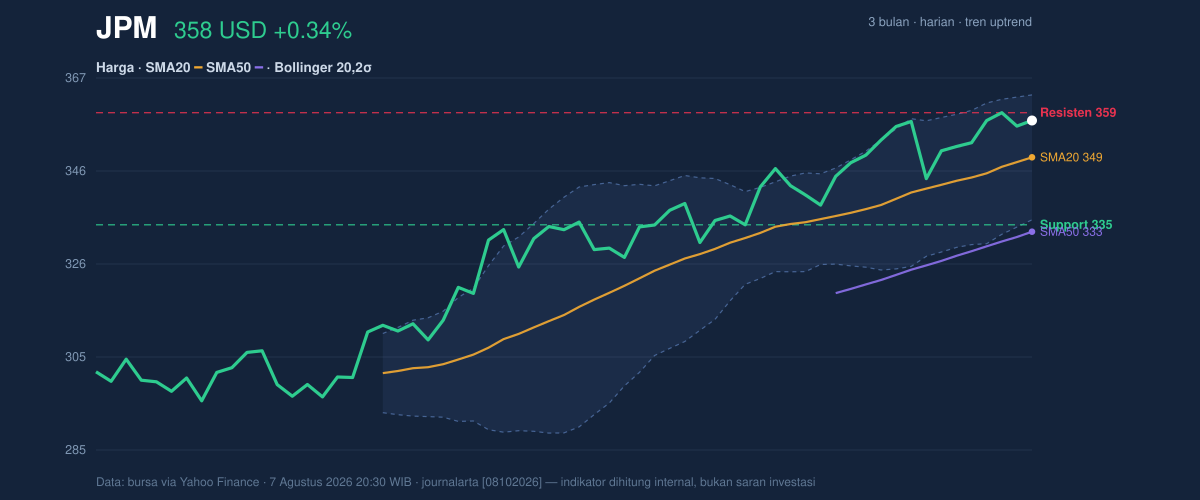
The broader three-month frame reinforces the same point. JPM is still below the 3-month high of 363.00, but well above the 3-month low of 293.67. That tells readers the stock has recovered meaningfully from its lower band, yet it has not fully escaped the ceiling that capped the prior advance.
Oscillators & Momentum
The momentum tools are more cautious than the price trend. RSI at 63.0 is still neutral, but it is leaning toward the upper side of the range, which usually means the stock has room left before it becomes stretched. The Stochastic reading of 78.7 / 79.7 is also neutral, but it is close to the overbought boundary. For non-specialists, that means recent gains have been persistent enough that the stock may need a pause before another push higher.
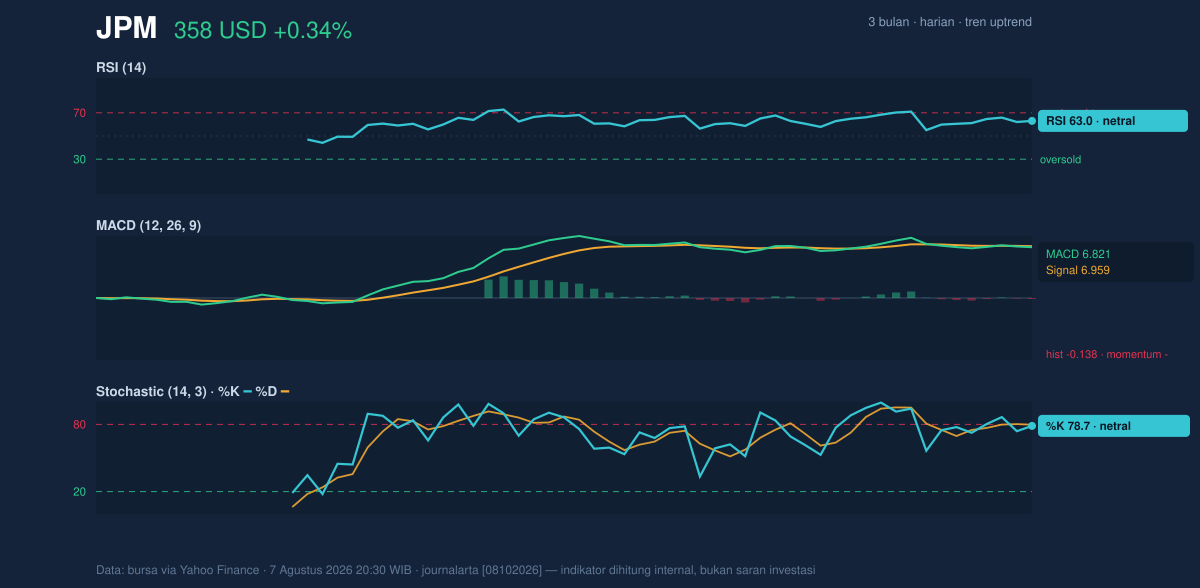
The more important warning comes from MACD at 6.821 versus signal at 6.959, with a histogram of -0.138. MACD is a trend-following momentum gauge; when it sits below its signal line and the histogram turns negative, it suggests buying pressure is losing some of its earlier edge. That does not automatically mean the stock is rolling over, but it does mean the advance is less synchronized than the price chart alone would imply.
In practical terms, the message is mixed: price is still constructive, but momentum has not confirmed a fresh acceleration. That kind of setup often produces either a brief consolidation or a slow grind rather than a clean breakout on the first attempt.
Volatility & Volume
Bollinger Bands add another layer to that reading. JPM is trading with %B at 79%, which places the shares in the upper portion of the band structure, close to the top band at 363.17. That means the stock is extended relative to its recent average, but not yet at a level that would imply immediate exhaustion. More importantly, the 7.9% band width is narrowing, which points to a squeeze. A squeeze often precedes a larger move, but it does not say which direction the move will take.
The volume pattern is where the breakout case becomes more tentative. Last volume was 4,565,200, only 0.6x the 20-session average of 8,088,330. Thin participation on a move near the highs can mean the market is waiting rather than committing. Yet OBV is rising, and that matters because OBV tracks whether volume is accumulating on up days. Rising OBV suggests that, despite the quiet tape, ownership is still gradually shifting in favor of the bulls.
The combination is subtle but important: price is near resistance, volatility is compressed, and volume is light. That is the sort of setup that can produce a decisive move if fresh demand arrives, but it can also stall if buyers fail to show up.
Key Levels & Scenarios
The immediate map is clear. Resistance at 359.24 is the first level to watch, with 363.17 as the Bollinger upper band and 363.00 as the recent 3-month high. If JPM pushes through that cluster, the chart would shift from “near resistance” to “price discovery above the prior ceiling,” which would be a meaningful technical change.
On the downside, support at 334.53 is the first line of defense, and it sits below SMA20 at 349.40. A failure to hold that support would weaken the current uptrend narrative and suggest the recent rally is losing structure. Because the stock is already near the top of its range, a slip back toward the middle band at 349.40 would also be a sign that the squeeze is resolving without upside follow-through.
Technical Verdict: HOLD (wait & see)
HOLD (wait & see) — the trend is still upward, but momentum is not fully aligned and volume is too light to confirm a clean breakout.
- Reason 1: Price remains above SMA20 at 349.40 and above SMA50 at 333.00, which keeps the trend constructive.
- Reason 2: MACD is negative versus its signal line, showing momentum has softened even as price holds near highs.
- Reason 3: Bollinger Bands are squeezing and volume is only 0.6x the 20-session average, so the next move may need stronger participation before it can be trusted.
- Verdict invalidated if price breaks below 334.53, the 20-hour support.
- Ideal Entry Range: 349.40 to 334.53
- Exit Target (Target Price): 359.24 to 363.17
- Stop Loss protection: below 334.53
For non-traders, this means JPM looks technically healthy, but the chart is asking for confirmation before the next move becomes clearer.
Summary Data JPM
| Last price | 357.52 USD |
| Change 1 day / 5 days / 1 month | 0.34% / 1.63% / 6.26% |
| Trend / MA-cross | uptrend / none |
| SMA20 / SMA50 | 349.40 / 333.00 |
| RSI (14) / Stochastic %K | 63.0 / 78.7 |
| Bollinger %B / ATR | 79% / 6.74 |
| Support / Resistance 20 days | 334.53 / 359.24 |
| Data as of | 7 Agustus 2026 20:30 WIB |

