MELI Stock Analysis: Gains 0.89%, Momentum Weakens
On Agustus 17, 2026: price 1,844.58 USD, trend sideways, RSI 52.1, support 1,798.70, resistance 1,940.00. technical analysis of meli stock.

For international investors watching Latin America’s biggest e-commerce and fintech name, MercadoLibre is sitting in a tense middle ground: the shares are above their longer trend line, but still trading just under a short-term average that often acts like a litmus test for near-term direction.
At 1,844.58 USD, MercadoLibre closed 0.89% higher than the previous 1,828.25, extending modest gains over 5 days and 1 month. But the signal beneath that surface is less decisive. The stock is in a sideways trend, with the SMA20 at 1,849.48 barely above the last price and the SMA50 at 1,764.36 still well below it. In plain terms, MELI is not in a clean breakout or breakdown pattern; it is drifting in a range, with buyers and sellers still negotiating control. As shown in the chart, that leaves the stock between short-term hesitation and medium-term support.
Trend & Price Action
The most important trend detail is that price sits below the SMA20 but above the SMA50. That combination usually means the stock has not lost its medium-term structure, yet it has failed to reclaim immediate momentum. There is no new MA-cross, which matters because moving-average crossovers often mark a shift in sentiment; without one, the chart is telling investors that the current phase is more pause than pivot. The sideways slope of the SMA20 also reinforces that message: the short-term trend is not accelerating in either direction.
The stock is trading at about 32% of its 20-hour range between 1,798.70 support and 1,940.00 resistance. That positioning is important because it shows MELI is closer to the lower end of the active trading band than the upper end, but not close enough to call it a clear test of support. The 3-month high of 1,946.00 sits just above nearby resistance, while the 3-month low of 1,528.67 remains far below, underscoring how much of the recent action has been compressed into a relatively narrow zone.
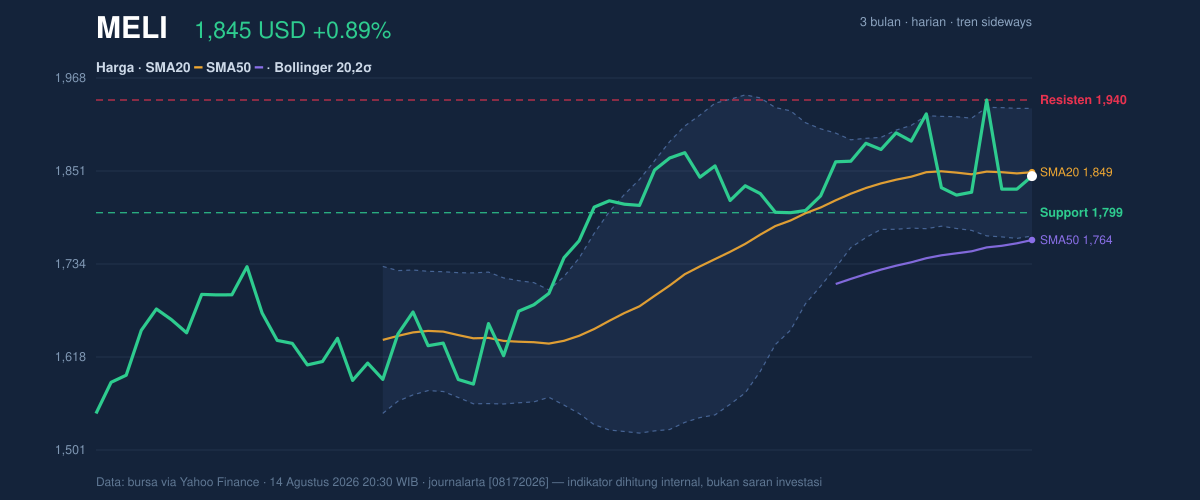
The practical read is simple: the stock has room to move, but it has not yet shown the conviction needed to leave the range behind.
Oscillators & Momentum
Momentum indicators are mostly neutral, but not all neutral readings are equally reassuring. The RSI at 52.1 is balanced, sitting just above the midpoint that separates weak from strong momentum. The Stochastic %K at 43.6 and %D at 37.6 also point to a market that is neither stretched nor washed out. That usually means the stock is waiting for a fresh catalyst rather than already pricing one in.
The more telling signal is the MACD. With MACD at 20.774, the signal line at 30.234, and the histogram at -9.461, momentum is currently negative. In technical terms, the MACD histogram below zero means the faster trend is lagging the slower one, which often happens when a stock is losing upward traction even if price has not yet broken down. That is a subtle but meaningful warning: the chart is not bearish outright, but it is not confirming strength either.
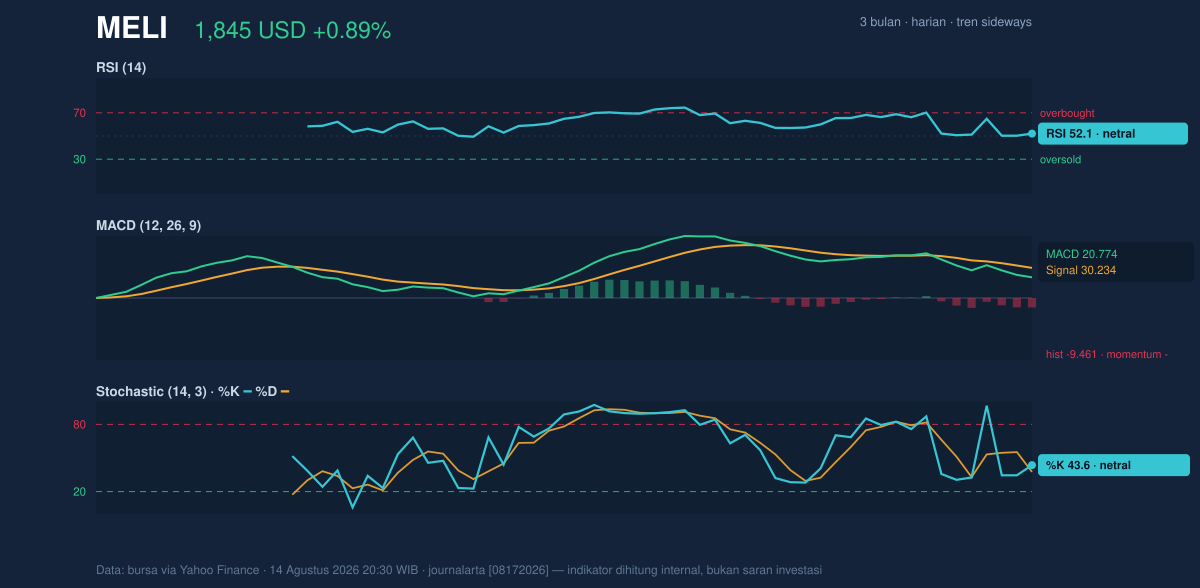
So the momentum picture is mixed: neutral oscillators, but a negative MACD that says the latest push has not fully convinced the market.
Volatility & Volume
Volatility is a bigger feature here than the calm price action suggests. The ATR(14) at 67.52, equal to 3.7% of price, indicates high volatility. ATR measures how much the stock typically moves in a session, so a reading like this tells readers that even a range-bound MELI can move sharply once it picks a direction. The Bollinger Bands are in a normal 8.7% width, with price at %B 47% and the middle band at 1,849.48. A %B reading near the middle band suggests the stock is not pressing an upper or lower extreme, which fits the sideways trend.
Volume, however, is not confirming enthusiasm. Last trade volume of 269,800 is only 0.6× the 20-hour average of 440,070, and OBV is down. OBV, or on-balance volume, tracks whether volume is flowing into or out of the stock; a falling OBV while price is still holding up can imply that rallies are not being backed by broad participation. That is often a warning sign for trend durability.
In other words, price is holding, but the crowd is not showing up in force.
Key Levels & Scenarios
The nearest technical floor is 1,798.70 support. If that level holds, the stock can keep working within its current band and potentially revisit the 1,849.48 area, which is both the SMA20 and the Bollinger midline. On the upside, 1,940.00 resistance is the first clear barrier, and the 1,946.00 3-month high sits just above it. A move through that zone would matter because it would place the stock back near the top of its recent trading envelope.
If price fails to hold 1,798.70, the chart would shift from consolidation to weakness, with the next reference coming from the lower Bollinger band at 1,769.42 and the still-lower SMA50 at 1,764.36. Those levels matter because they mark where the medium-term trend could start to look less stable.
Technical Verdict: HOLD (wait & see)
HOLD (wait & see)
- Price is below the SMA20 but above the SMA50, which leaves the chart in a neutral-to-mixed structure rather than a confirmed breakout.
- RSI 52.1 and Stochastic 43.6 / 37.6 are neutral, while the MACD histogram at -9.461 shows momentum is still negative.
- Volume at 0.6× normal and OBV down suggest the move lacks broad participation.
Verdict invalidated if price breaks below 1,798.70, because that would weaken the current range and expose the lower band and medium-term average.
- Ideal Entry Range: 1,798.70 to 1,849.48
- Exit Target: 1,940.00 to 1,946.00
- Stop Loss Protection: below 1,769.42 or, more conservatively, below 1,764.36
For non-traders, this means MercadoLibre is holding its ground, but the chart still needs stronger evidence before its next move becomes clearer.
Volume last traded at 269,800, versus a 20-hour average of 440,070.
Summary Data MELI
| Last price | 1,844.58 USD |
| Change 1 day / 5 days / 1 month | 0.89% / 1.31% / 1.69% |
| Trend / MA-cross | sideways / none |
| SMA20 / SMA50 | 1,849.48 / 1,764.36 |
| RSI (14) / Stochastic %K | 52.1 / 43.6 |
| Bollinger %B / ATR | 47% / 67.52 |
| Support / Resistance 20 days | 1,798.70 / 1,940.00 |
| Data as of | 14 Agustus 2026 20:30 WIB |


