LLY Stock Technicals Today: Gains 3.60%, Testing Key Resistance
On Agustus 19, 2026: price 1,225.73 USD, trend uptrend, RSI 58.0, support 1,115.68, resistance 1,231.94. technical analysis of lly stock.

Eli Lilly shares climbed to 1,225.73 USD on the NYSE, up 3.60% from the previous close of 1,183.16, with the move pushing the stock into the upper end of its recent trading band, as shown in the chart. The advance matters because it is not just a one-day pop: Lilly is now trading above both its short- and medium-term averages, while momentum indicators still point to underlying strength even as some shorter-term gauges look stretched. That combination usually tells traders the trend is intact, but the stock may need a pause before any further extension.
Trend & Price Action
The price sits above the SMA20 at 1,186.34 and the SMA50 at 1,172.58, which is a constructive setup for trend followers. In plain English, the stock is holding above the levels that often act like a market’s “memory” of recent value, meaning buyers have been willing to pay more than they did over the past month and two months. The uptrend is also being supported by the 0.81%/5-day slope of the SMA20, a sign that the short-term baseline is still rising rather than flattening out.
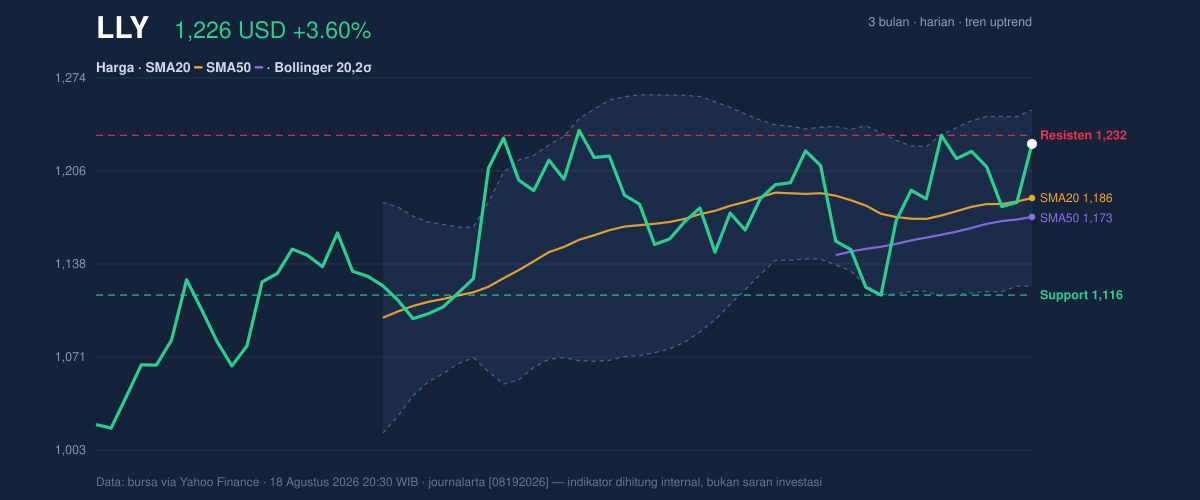
The stock is now near the top of its 20-hour range, with support at 1,115.68 and resistance at 1,231.94, and it is sitting at roughly 95% of that range. That positioning is important because it shows the market has already priced in a strong near-term move; when price lives close to resistance, the next test is whether buyers can absorb supply above the recent ceiling. The broader picture is also relevant: the 3-month high of 1,249.45 is not far away, while the 3-month low of 984.60 shows how far the shares have traveled from the weaker tape earlier in the period.
The Bollinger upper band at 1,250.49 sits just above the recent high zone, while the middle band matches the SMA20 at 1,186.34. That alignment means the stock is trading well above its short-term average but not yet outside the normal statistical envelope. The %B reading of 81% says the price is high in the band, which usually signals strength, but also warns that the easy part of the move may already be behind it.
Oscillators & Momentum
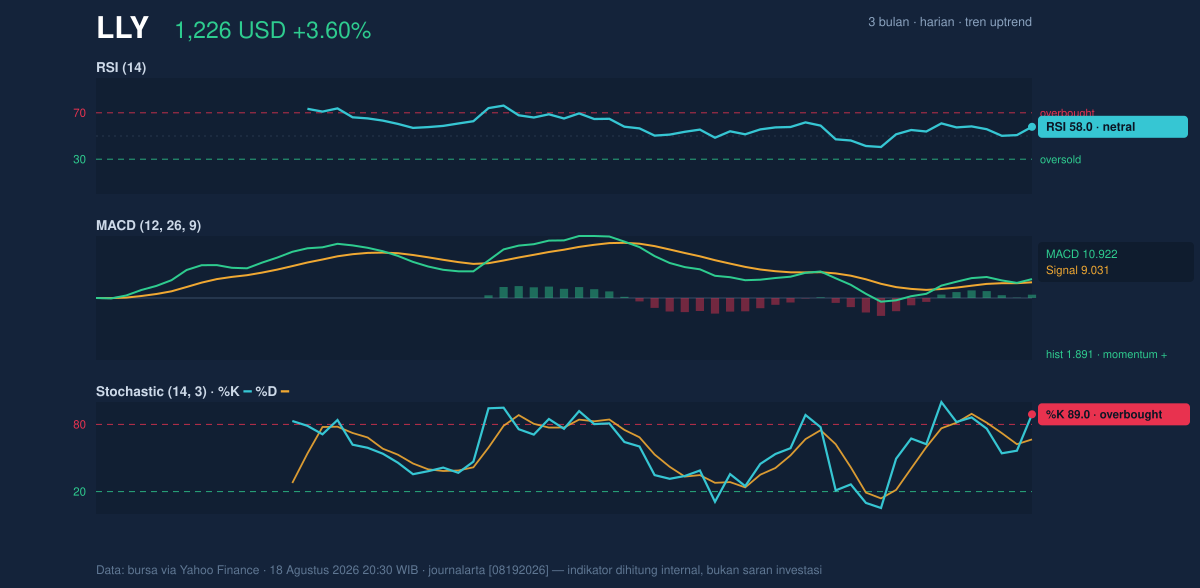
Momentum is mixed, and that is where the story becomes more interesting. The RSI at 58.0 is neutral, so it does not scream overbought or oversold. That matters because RSI is often used to judge whether a move is running too hot; here, it suggests the stock still has room to move without immediately entering an extreme zone. By contrast, the Stochastic %K at 89.0 and %D at 66.6 are in overbought territory, which means the stock has risen quickly enough that short-term traders may start locking in gains. Overbought does not mean “about to fall”; it means the pace of the advance has been fast enough to merit caution.
The MACD at 10.922, above its signal line at 9.031, with a positive histogram of 1.891, is the clearest bullish confirmation in the set. MACD is a trend-following indicator, and when it stays above the signal line with a positive histogram, it implies upward momentum is still dominating the recent price pattern. In other words, the stock is not just drifting higher — buyers are still in control of the trend, even if the move is starting to look mature on a short-term oscillator like Stochastic.
Volatility & Volume
Volatility is elevated. The ATR(14) of 45.27, equal to 3.7% of price, indicates the stock can move a meaningful distance in a single session. For readers, ATR is a measure of typical daily movement, so a higher reading means wider swings and less predictable intraday paths. That is especially relevant near resistance, because a stock with high ATR can either break out decisively or reverse sharply once momentum fades.
Volume was 2,506,500, below the 20-hour average of 2,644,010, or about 0.9x normal. That is a subtle but important signal: the price advanced without unusually heavy participation. When a stock rises on lighter-than-average volume, it can still be healthy, but the move is less emphatic than if institutions were clearly leaning in. The OBV is rising, however, which suggests that over time more volume has been flowing into up days than down days. That helps validate the trend, even if the latest session was not a volume surge.
Key Levels & Scenarios
The immediate technical map is straightforward. 1,231.94 is the first resistance to watch, and the 1,250.49 Bollinger upper band is the next visible ceiling. On the downside, 1,186.34 is the first important pivot because it is both the SMA20 and the Bollinger middle band, while 1,115.68 is the deeper support that would likely matter if the current trend loses traction. If price clears resistance with stronger participation, the chart suggests room to probe the recent high zone near 1,249.45. If it slips back below the mid-band area, the market would be signaling that the latest push was more extension than acceleration.
Technical Verdict: HOLD (wait & see)
HOLD (wait & see)
- The MACD is positive and still above its signal line, which keeps the broader trend constructive.
- The price is above the SMA20 and SMA50, so the medium-term structure remains bullish.
- The Stochastic is overbought and price is already near 1,231.94 resistance, which raises the odds of near-term hesitation.
Verdict invalidated if price falls below 1,115.68.
- Ideal entry range: 1,186.34 to 1,115.68
- Exit target: 1,231.94 to 1,250.49
- Stop loss protection: below 1,115.68
For non-traders, this means the stock still looks technically healthy, but it is close enough to resistance that the next move could be a pause rather than a clean sprint. “We have momentum, but we are not out of the woods on the upside yet.”
Summary Data LLY
| Last price | 1,225.73 USD |
| Change 1 day / 5 days / 1 month | 3.60% / 0.88% / 4.28% |
| Trend / MA-cross | uptrend / none |
| SMA20 / SMA50 | 1,186.34 / 1,172.58 |
| RSI (14) / Stochastic %K | 58.0 / 89.0 |
| Bollinger %B / ATR | 81% / 45.27 |
| Support / Resistance 20 days | 1,115.68 / 1,231.94 |
| Data as of | 18 Agustus 2026 20:30 WIB |
Track LLY stock price daily: live levels, support/resistance and our full LLY analysis history.


