DIS Stock Analysis: Gains 0.56%, Momentum Weakens
On September 28, 2026: price 106.15 USD, trend sideways, RSI 52.8, support 102.67, resistance 108.59. technical analysis of dis stock. DIS Stock Analysis —…

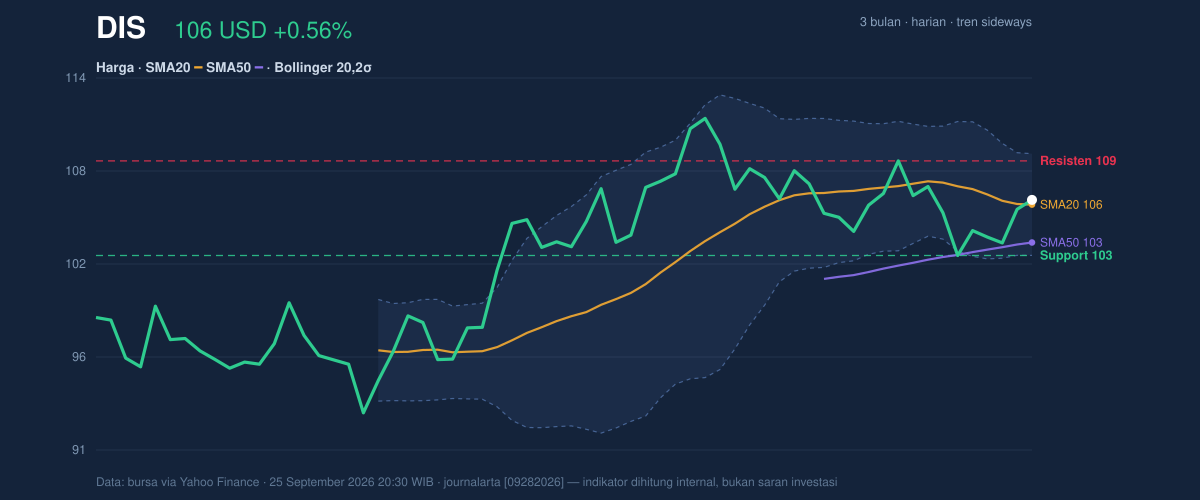
Walt Disney (DIS) closed at 106.15 USD, up 0.56% on the day, but the broader message from the chart is more restrained: the stock is still moving sideways, sitting just above its short-term average while momentum remains mixed. As shown in the chart, Disney is holding above SMA20 at 105.86 and well above SMA50 at 103.49, yet the signal set is not fully aligned — a sign that buyers are present, but not fully in control.
Trend & Price Action
The most important trend signal is that Disney is trading above SMA20 and above SMA50, which usually tells traders the medium-term structure is healthier than the recent price drift suggests. But the slope of SMA20 at -1.07% over 5 days shows that the short-term trend is still easing, not accelerating. In plain terms, the stock is not breaking down, but it is also not yet showing a decisive upward push. The absence of a new MA-cross matters here: there is no fresh moving-average crossover to confirm a trend change, so the market is still waiting for evidence that the recent rebound can become something more durable.
Price is currently sitting around the middle of its recent trading band, at 59% of the 20-hour range, which suggests balance rather than urgency. The 3-month high of 111.87 is close enough to matter as overhead supply, while the 3-month low of 92.49 remains the deeper support zone that frames the larger range. The stock is not stretched, but it is not cheap enough to imply a clean reset either.
Oscillators & Momentum
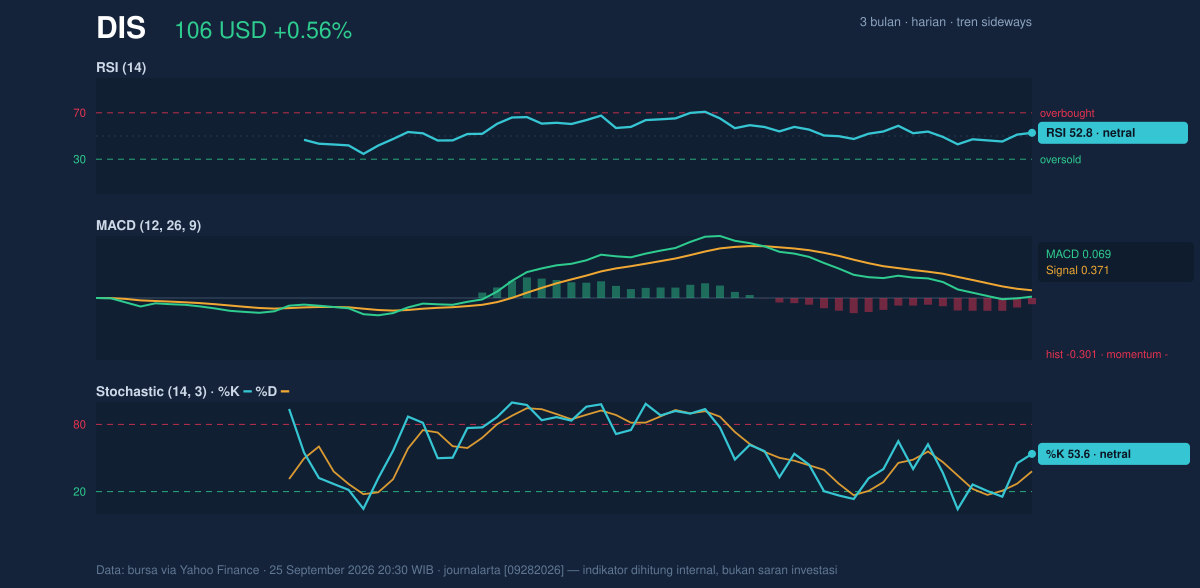
The oscillator picture is neutral on the surface, but the details lean cautious. RSI at 52.8 sits in the middle of the scale, which means Disney is neither overbought nor oversold. That is usually a sign of indecision, not conviction. Stochastic %K at 53.6 and %D at 38.1 also point to a market that has room to move either way, but the gap between the two lines is not yet a strong trend confirmation. As shown in the chart, the oscillator set is not flashing a reversal warning, but it is also not delivering the kind of synchronized lift that often accompanies a sustained advance.
The more important signal is the MACD at 0.069 versus its signal line at 0.371, leaving a -0.301 histogram. That negative histogram means current momentum is weaker than the underlying trend line, a classic sign that price may be stabilizing without yet regaining thrust. In practical terms, Disney can hold its range with this setup, but it needs stronger participation to turn a sideways pattern into a cleaner upswing.
Volatility & Volume
Volatility is not elevated, but it is setting up for a possible expansion. The Bollinger Bands are relatively tight, with the upper band at 109.04, the middle band at 105.86, and the lower band at 102.68. The 6.0% band width indicates a squeeze, which often precedes a larger move. That does not tell direction by itself, but it does tell us the market is compressing energy. Because price is near the center of the band and %B is 55%, Disney is not pressing the upper boundary; it is still trading in the middle of the field.
Volume adds a caution flag. Last volume was 7,246,700, below the 20-day average of 8,067,305, or about 0.9x normal. That means the latest rise did not arrive with strong participation. The OBV is falling, which matters because on-balance volume tracks whether money flow is accumulating or leaving the stock. A falling OBV while price holds up is often a warning that the advance lacks broad sponsorship. The ATR at 2.18, or 2.1% of price, says day-to-day movement is moderate rather than wild, so any breakout from the squeeze may still need a catalyst to stick.
Key Levels & Scenarios
Disney’s immediate map is straightforward. The nearest support is 102.67, which closely matches the lower Bollinger band at 102.68. That alignment makes this area important: if price slips back there, the market is likely testing whether the recent base can absorb selling pressure. On the upside, resistance is 108.59, just below the Bollinger upper band at 109.04. That zone is the first meaningful barrier for a move that wants to prove itself.
If Disney clears 108.59 with volume expanding above the recent 0.9x normal pace, the squeeze would begin to resolve upward and the stock could re-test the upper end of the recent range near 111.87. If price fails to hold 102.67, the chart would shift from consolidation into a weaker structure, with the lower band no longer acting as a cushion. Right now the stock is neither breaking out nor breaking down; it is coiling.
Technical Verdict: HOLD (wait & see)
- RSI at 52.8 and Stochastic at 53.6/38.1 are neutral, so momentum is not strong enough to confirm a trend.
- MACD histogram at -0.301 shows momentum is still lagging the price structure.
- Bollinger squeeze at 6.0% suggests a larger move may be coming, but direction is not confirmed.
Verdict invalidated if price falls below 102.67, because that would break the nearest support and the lower Bollinger boundary at the same time.
- Ideal Entry Range: 102.67 to 105.86
- Exit Target (Target Price): 108.59 to 109.04
- Stop Loss protection: below 102.67
In plain English: Disney is holding up, but the chart still needs stronger proof before the next move can be trusted.
“The market is waiting for Disney to show that this squeeze is a launchpad, not just a pause.”
Summary Data DIS
| Last price | 106.15 USD |
| Change 1 day / 5 days / 1 month | 0.56% / 3.39% / -0.63% |
| Trend / MA-cross | sideways / none |
| SMA20 / SMA50 | 105.86 / 103.49 |
| RSI (14) / Stochastic %K | 52.8 / 53.6 |
| Bollinger %B / ATR | 55% / 2.18 |
| Support / Resistance 20 days | 102.67 / 108.59 |
| Data as of | 25 September 2026 20:30 WIB |

